Mohammad Mohammadieh

Data Analyst, Beirut, Lebanon

I build Power BI dashboards and the Microsoft Fabric data models behind them.

I'm a data analyst in Beirut. I work mostly in Power BI: data models, DAX measures and row-level security, for public-sector and institutional clients. I also build the tools around the reports: Power Apps, Power Automate flows and a Copilot Studio agent.

I care about numbers people can trust. That means KPIs agreed with the people who will use them, one model behind every page, access rules that show each user only their own data, and tests where the answer has to be right.

From my current role

Tableau dashboards converted to Power BI, in a 200+ dashboard migration program
60+
companies using the sales reporting app in production
4
automated tests verifying the AI agent demo
200+

1Work

CCI ICT Innovations

Data Analyst

Beirut, LebanonNov 2024 to Present

  • Converted and optimized 60+ Tableau dashboards to Power BI within a 200+ dashboard migration program, rebuilding data models, DAX measures and row-level security.
  • Build Power BI dashboards and Microsoft Fabric data models for public-sector and institutional clients, defining KPIs with client stakeholders.
  • Delivered a Power Apps sales reporting app to production across four companies, with 240+ sales meeting reports logged.
  • Built a Copilot Studio AI agent demo for an industrial maintenance use case, verified by 200+ automated tests.
ITCAN Solutions

Information Management Engineer

Saida, LebanonFeb 2024 to Oct 2024

  • Configured and maintained gateways and enterprise applications.
  • Built automation enhancements and custom solutions for operational needs.
  • Extracted and transformed operational data to support business processes and decisions.

Maids.cc

Data Analyst

Dubai, UAE (Remote)Sept 2023 to Feb 2024

  • Wrote MySQL queries with joins, subqueries and conditional logic to extract and transform operational data.
  • Built Tableau reports and analyses used for operational decision-making.

2Projects

These projects were built for my employer or its clients. Client names and real data are confidential, so every case study uses synthetic data.

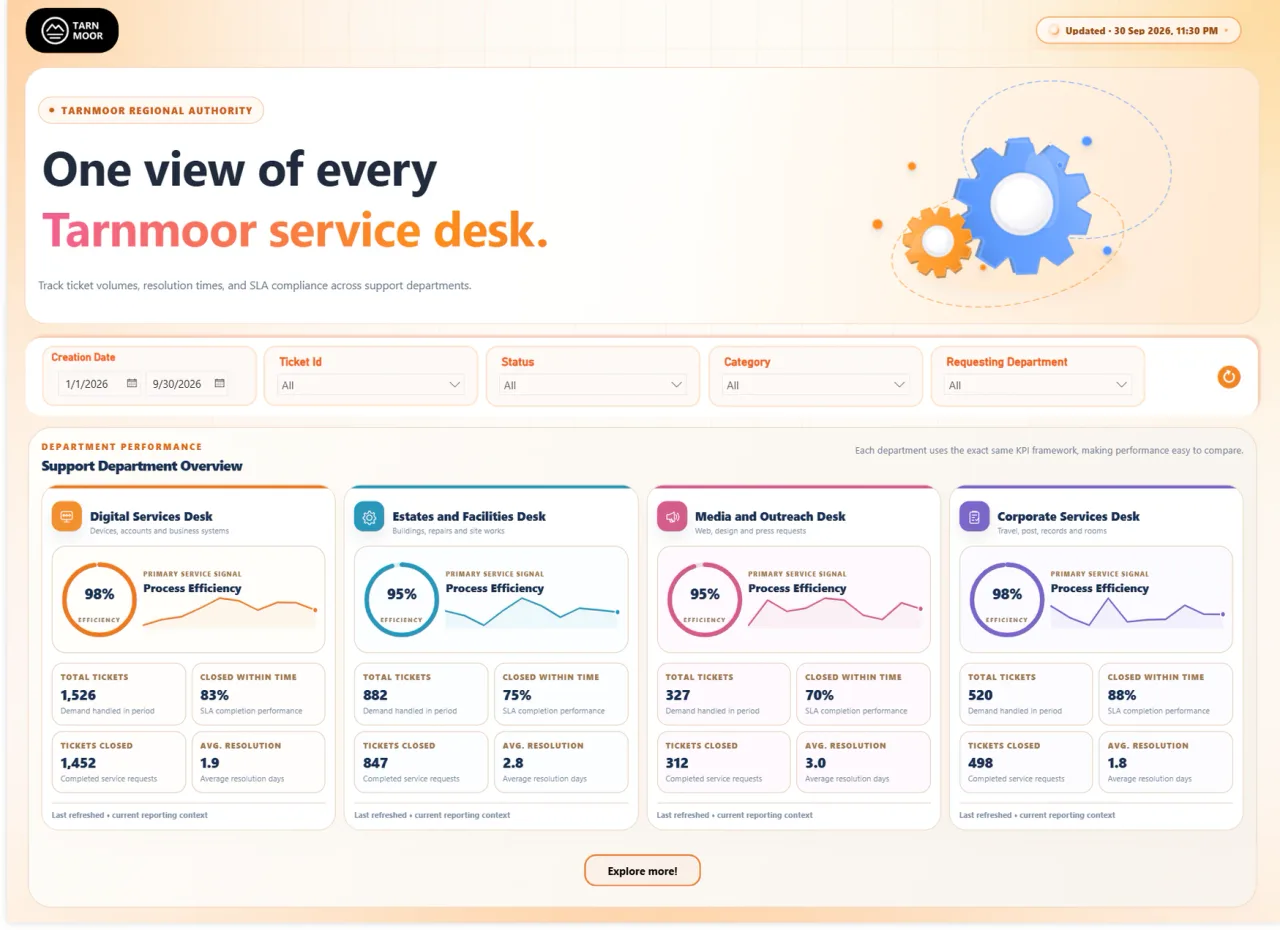
Dashboard page with a headline banner and gear artwork, a row of five filters, and four side-by-side desk cards, each with a percentage ring, a small trend line and four figures.

2.1

Service Desk Analytics

Executive and operational Power BI dashboards for four public-sector service desks, all on one Microsoft Fabric data model.

public-sector service desks
4
Microsoft Fabric data model
1
DAX measures in the original model
55
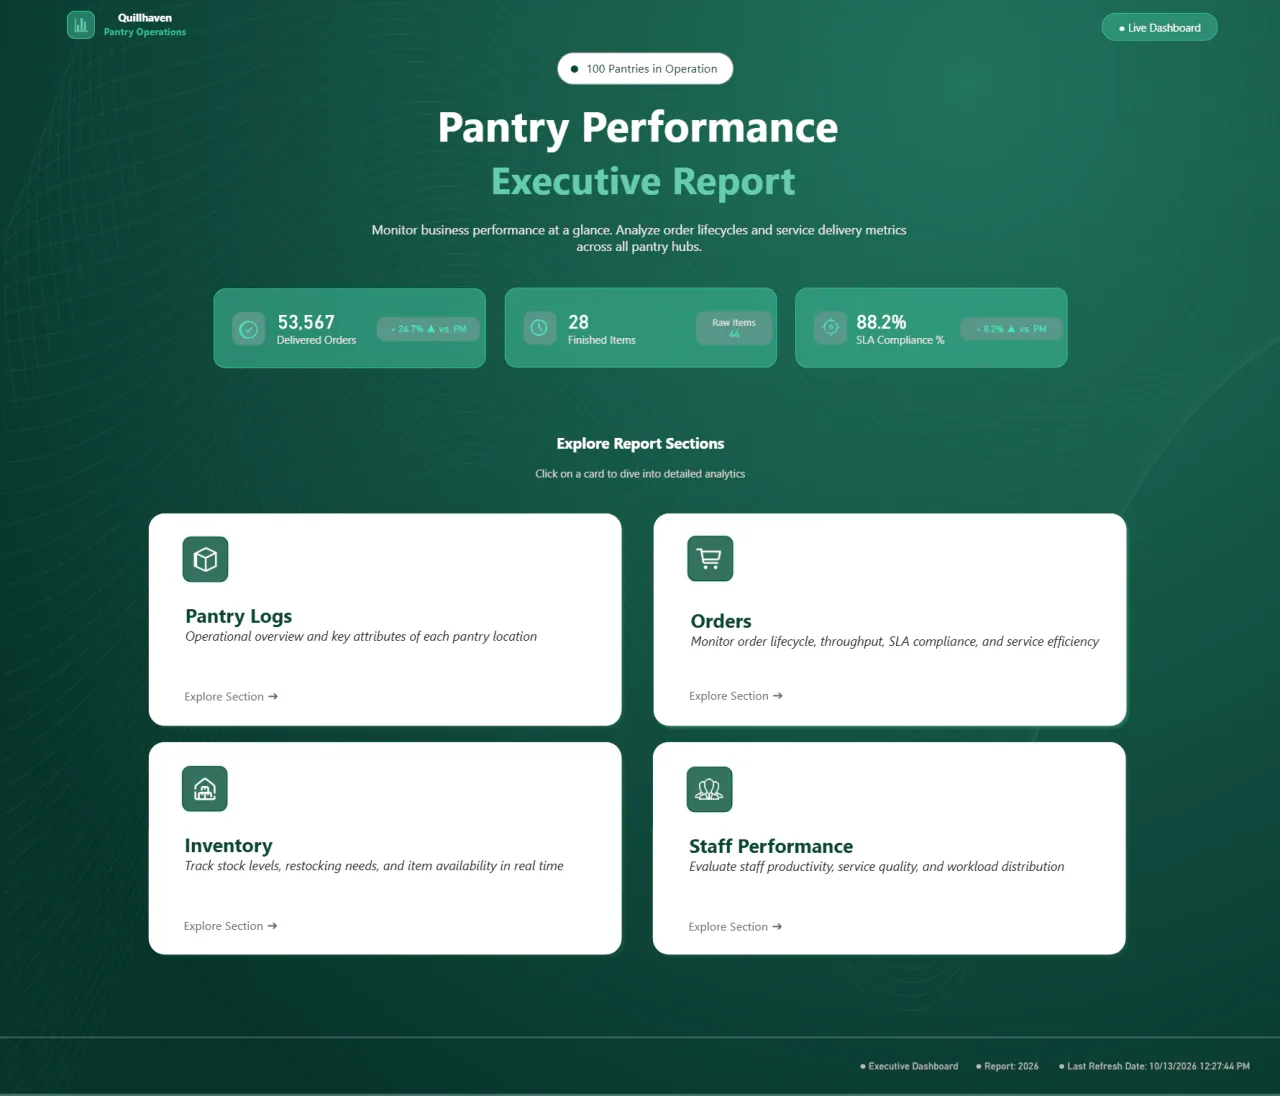
Dark green landing page titled "Pantry Performance Executive Report" with three KPI tiles and four white cards named Pantry Logs, Orders, Inventory and Staff Performance.

2.2

Operations Dashboard with Row-Level Security

A 10-page Power BI report on orders, SLA compliance, stock and consumption across 100+ sites, where each user sees only their own sites.

report pages
10
measures
70+
sites
100+
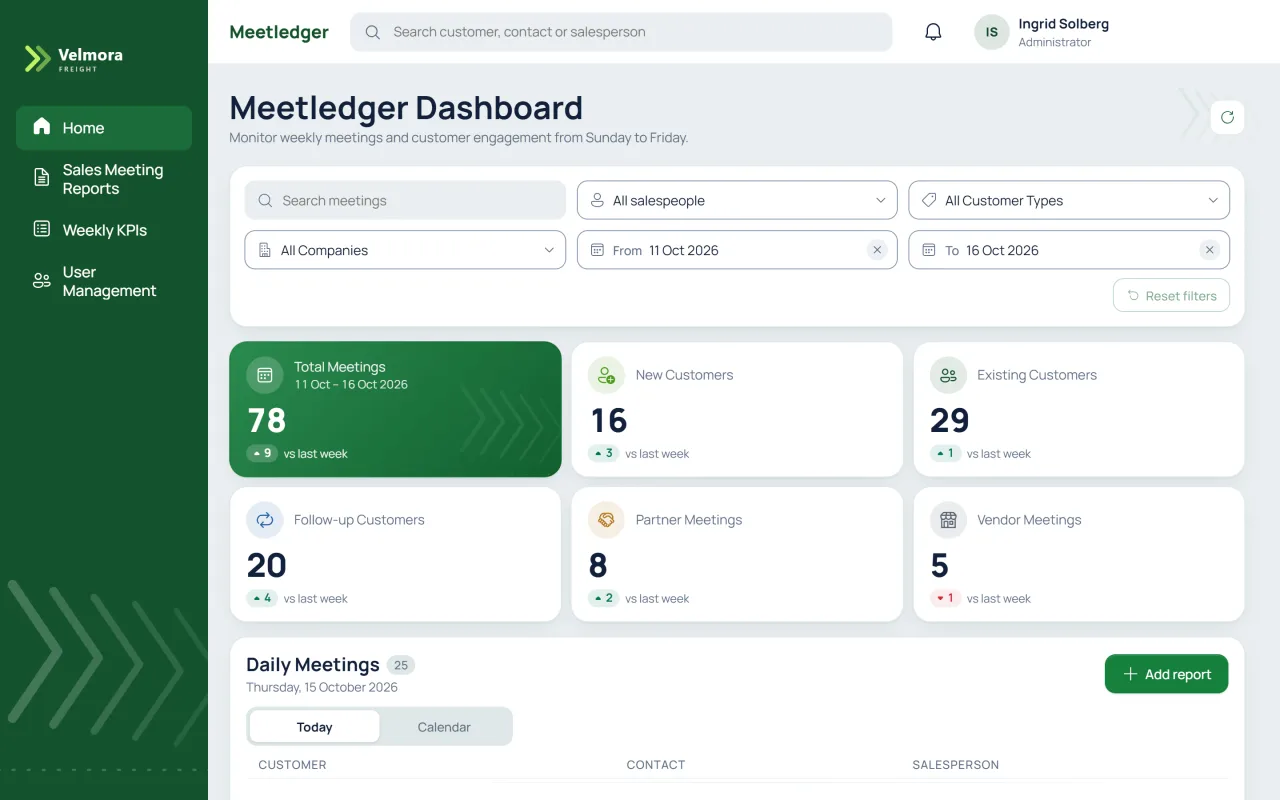
Meetledger dashboard in the green Velmora Freight theme, signed in as an administrator. A filter bar sits above six key-figure cards; the first shows 78 total meetings for 11 to 16 October 2026, up 9 on last week, and the others count new, existing, follow-up, partner and vendor meetings. The Daily Meetings list starts below.

2.3

Multi-Company Sales Management App

An app where sales teams log client meetings and track weekly KPI targets, with automated weekly Excel reports to managers and midweek target alerts.

companies in production
4
sales meeting reports logged
240+
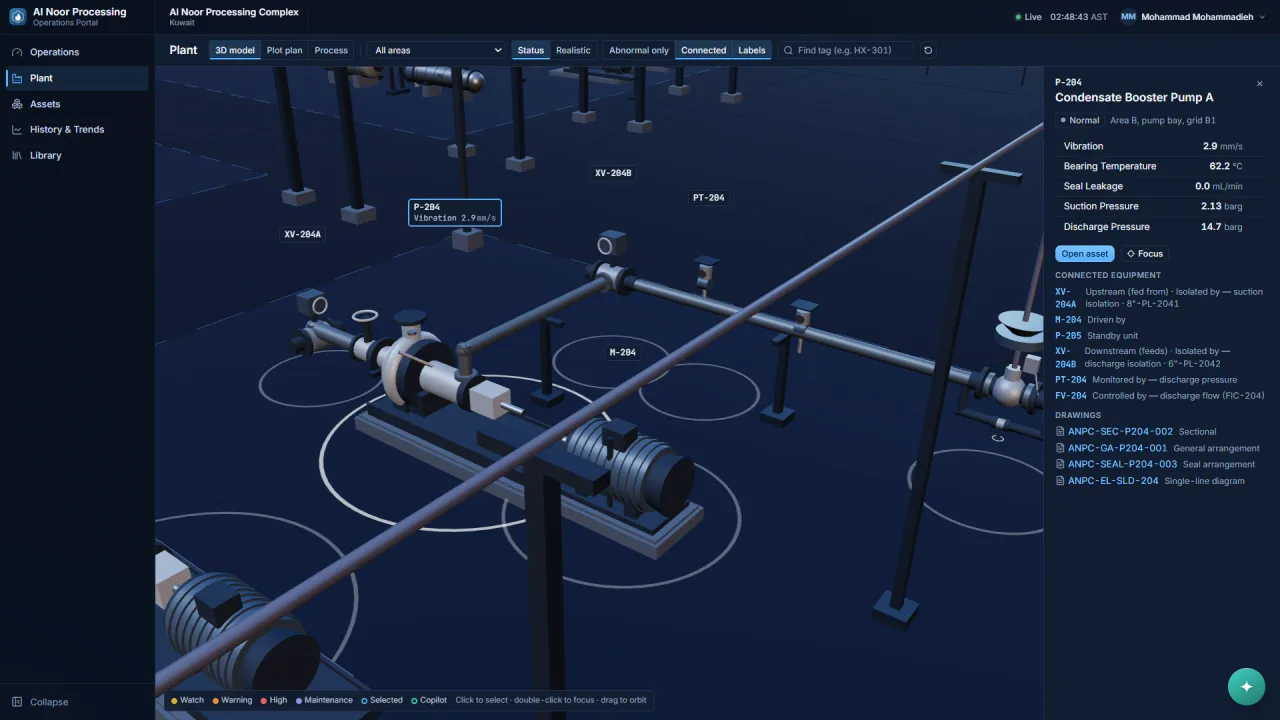
Close 3D view of a pump and motor on a skid with pipework and tag labels; a side panel lists vibration, bearing temperature, seal leakage and pressures for P-204, its connected equipment and four linked drawings.

2.4

Industrial Maintenance AI Agent

A demo in which an AI agent investigates equipment faults from sensor data, drafts maintenance work packs and routes them for approval.

automated tests
200+
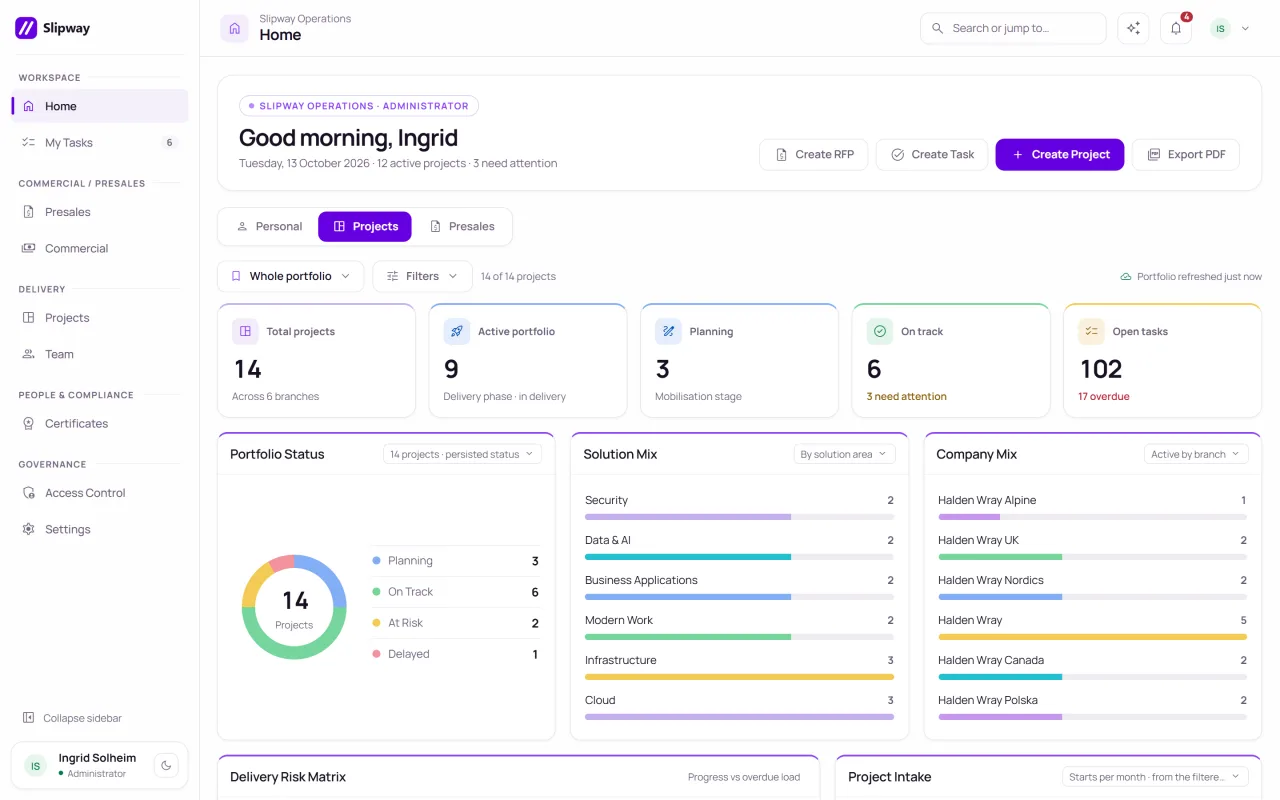
Dashboard with five summary tiles, a donut chart of project status and two bar lists, beside a left-hand navigation menu.

2.5

Enterprise Operations Platform

A team project I contributed to: an internal platform that follows an opportunity from the RFP pipeline into project delivery, with access for five roles.

user roles
5

3Skills

Business Intelligence
Power BI, DAX, Power Query (M), semantic modeling, row-level security, Tableau, Excel
Data Platforms
Microsoft Fabric (Lakehouse, Direct Lake), SQL (SQL Server, MySQL), KQL, Python
Power Platform and Cloud
Power Apps, Dataverse, Power Automate, Copilot Studio, Azure, Microsoft Entra ID, Git
Languages
Fluent in English and Arabic

4Education

Rafik Hariri University

Bachelor of Business Administration in Information Technology Management

Mechref, LebanonSept 2020 to May 2023

5Contact