Project 2.2
Operations Dashboard with Row-Level Security
A 10-page Power BI report on orders, SLA compliance, stock and consumption across 100+ sites, where each user sees only their own sites.
- report pages
- 10
- measures
- 70+
- sites
- 100+
1Walkthrough and screens
Recorded in Power BI Desktop's editing view, so small hover icons and a selection outline appear in the videos.
 Open at full size
 Open at full size
 Open at full size
 Open at full size
 Open at full size
 Open at full size
 Open at full size
 Open at full size
 Open at full size
 Open at full size
 Open at full size
 Open at full size
 Open at full size
2The problem
Orders, SLA compliance, stock and consumption had to be reported across 100+ sites, to users who should each see only their own sites.
3What I built
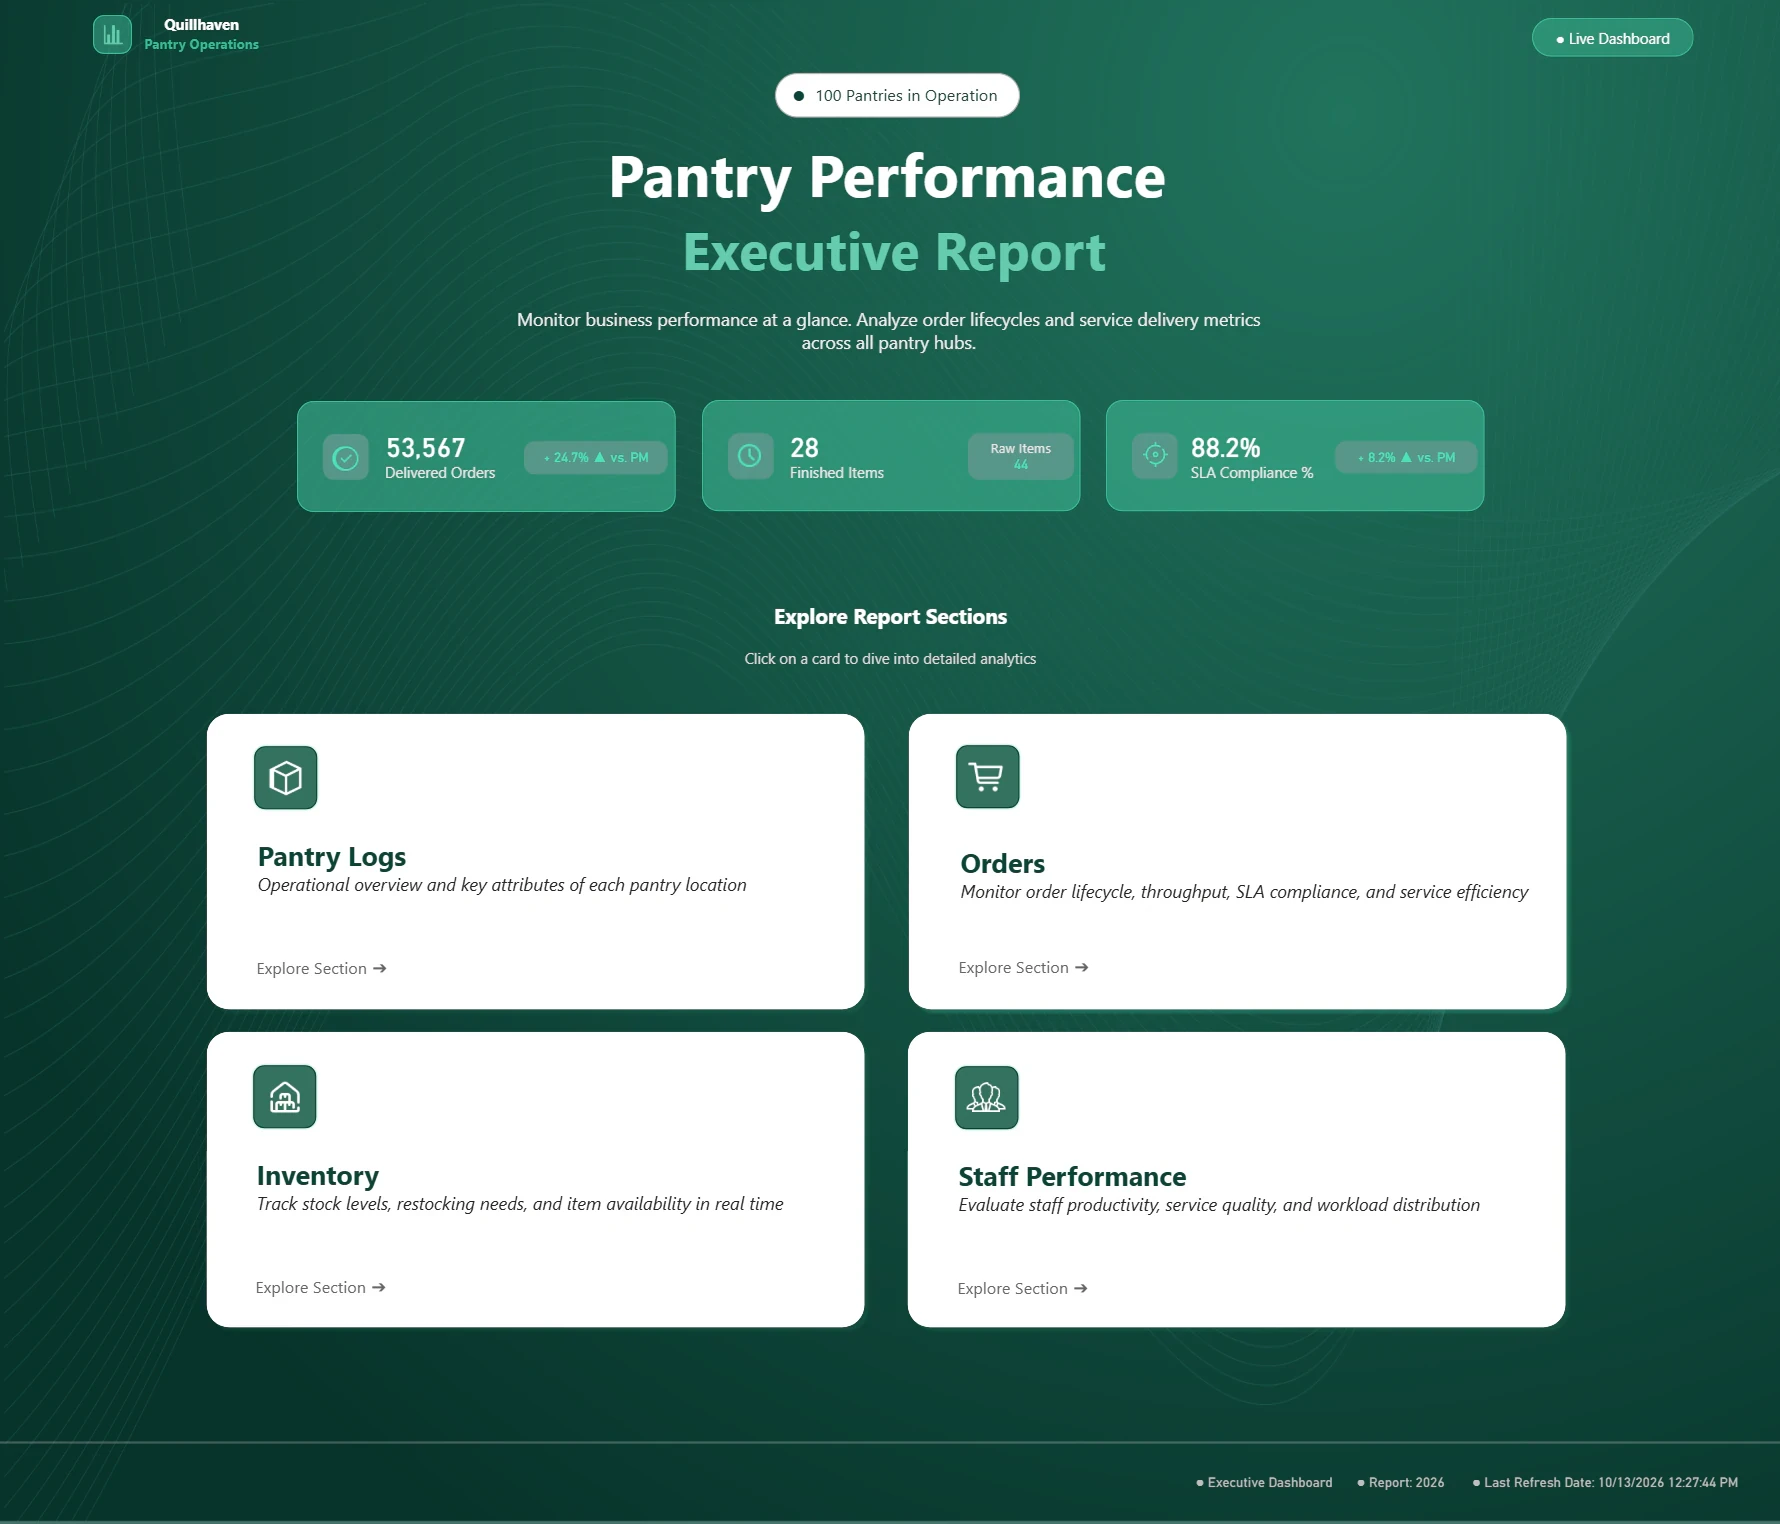
I built a 10-page Power BI report with 70+ measures. Row-level security limits each user to their own sites. The Home page, header, navigation and filter panel are my design, and each content page has four KPI cards and custom visuals.
4How it works
- Power BI. One report, 10 pages, 70+ measures.
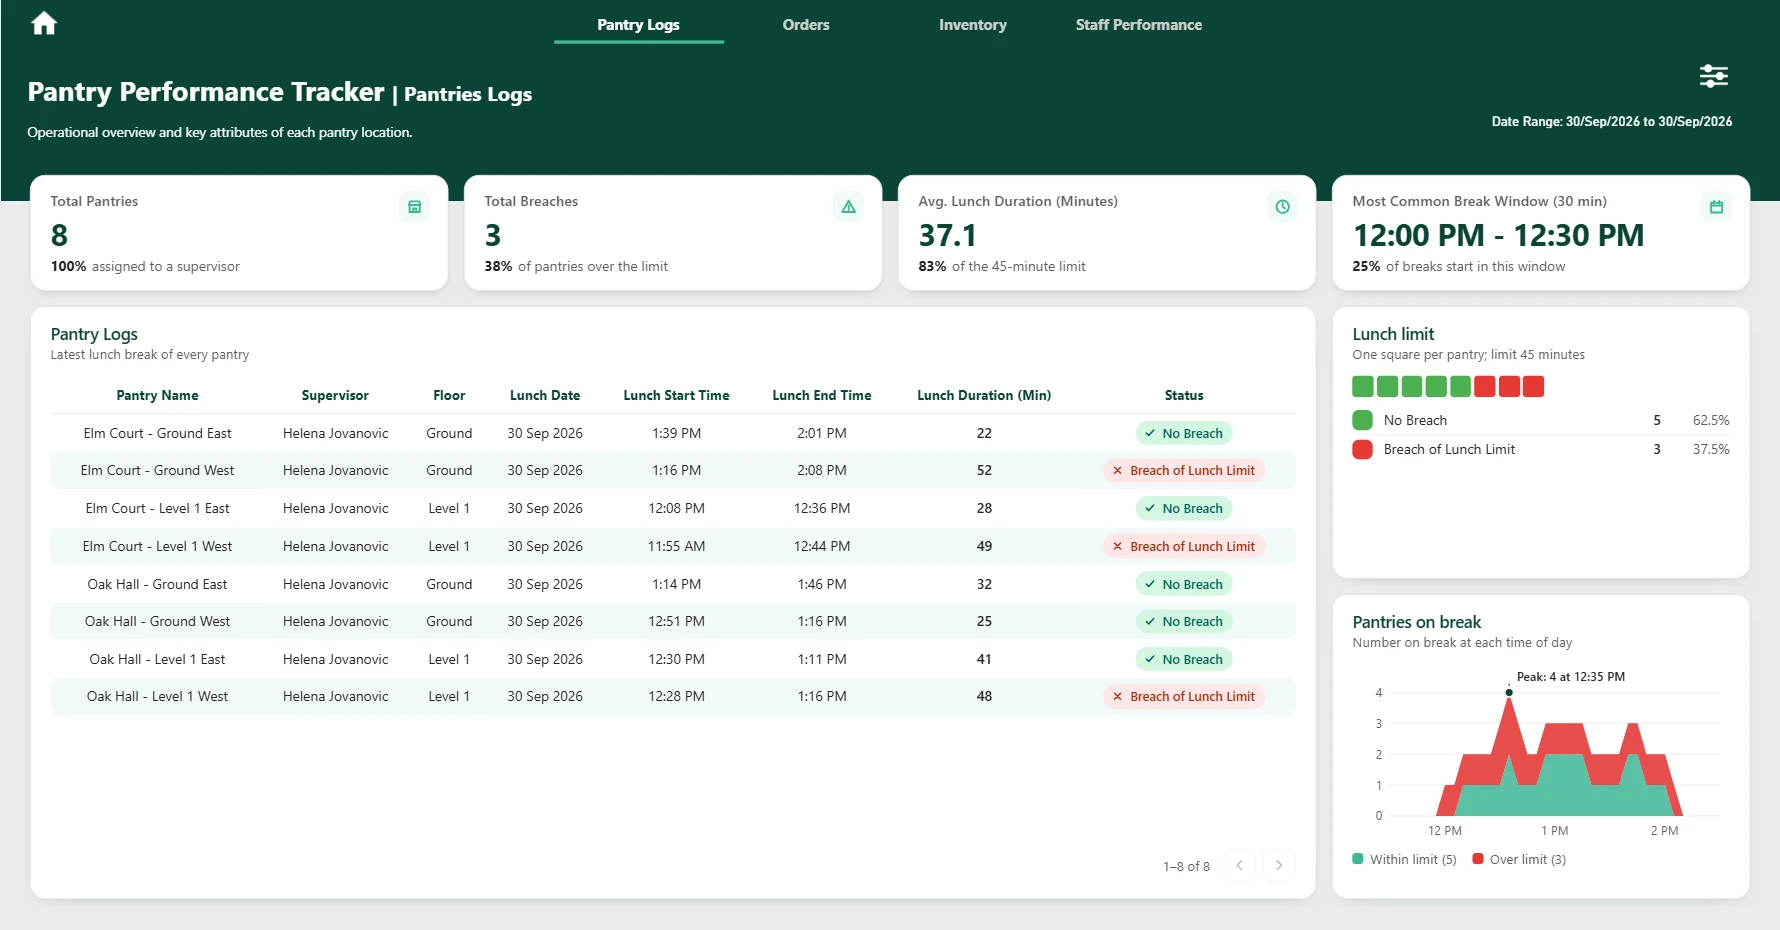
- Row-level security. One dynamic role limits a supervisor to their own pantries. It is shown here with View as in Power BI Desktop.
5What it shows
- Home. Headline figures and section cards that lead into nine content pages.
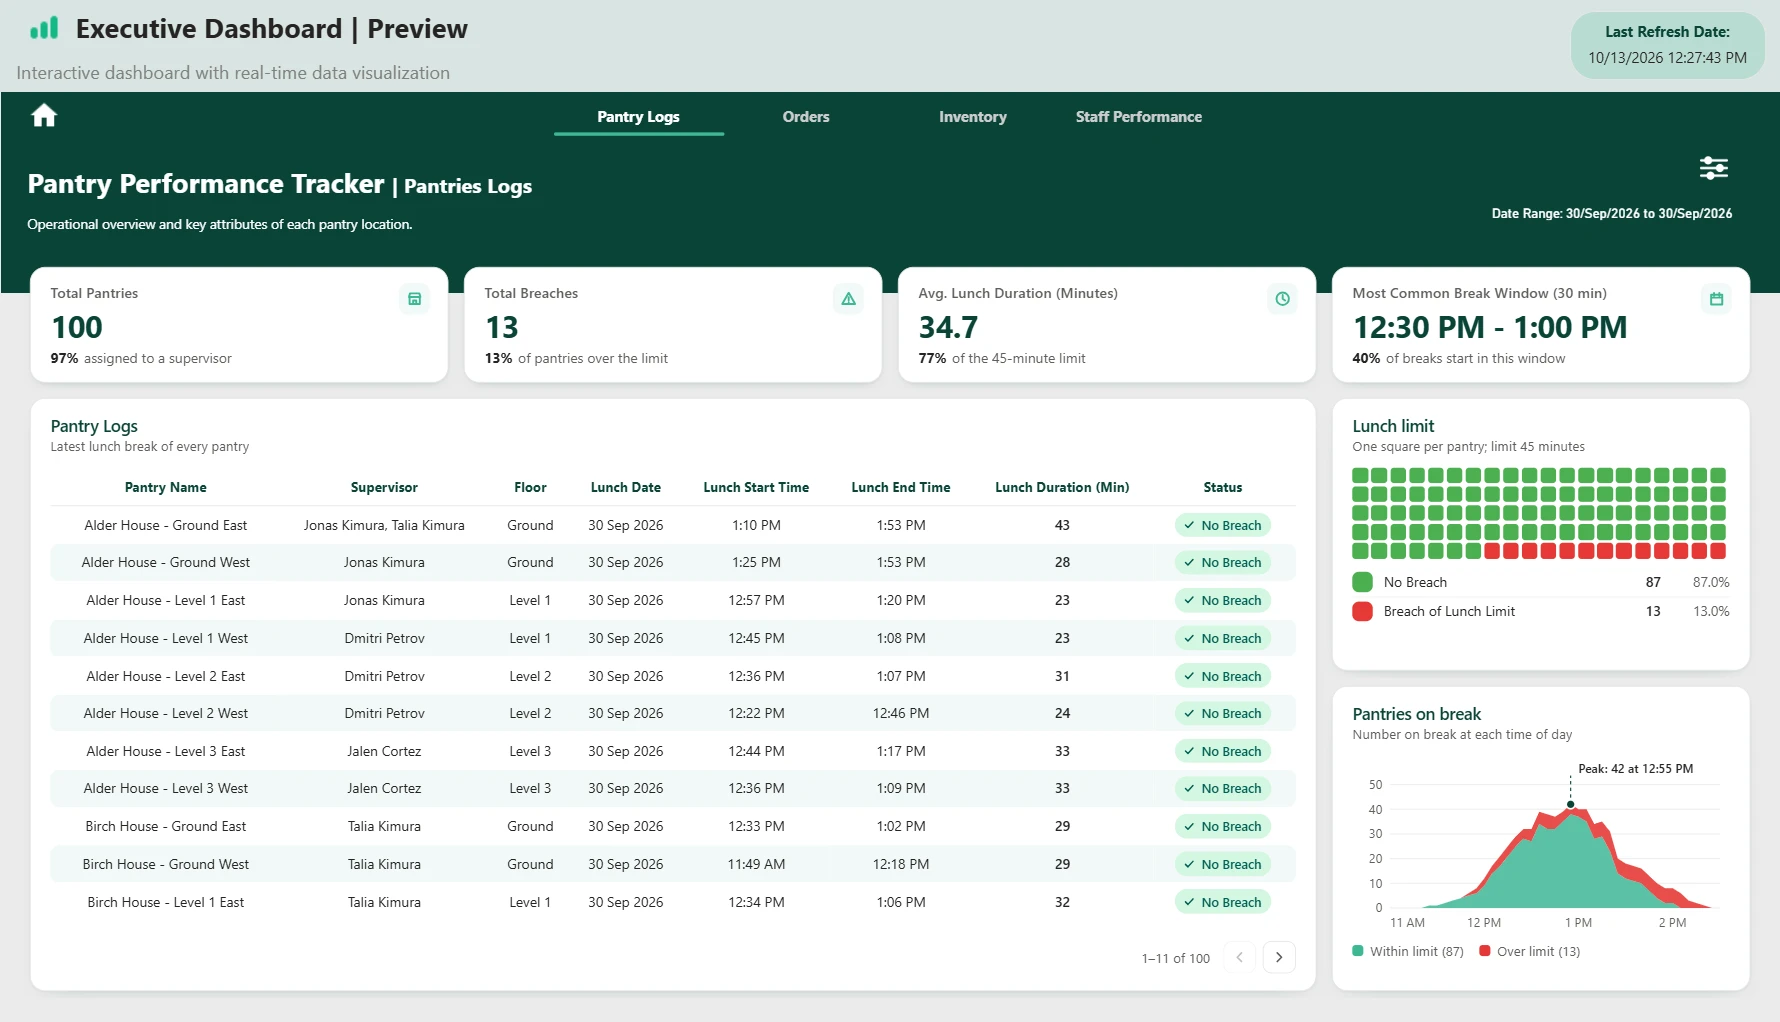
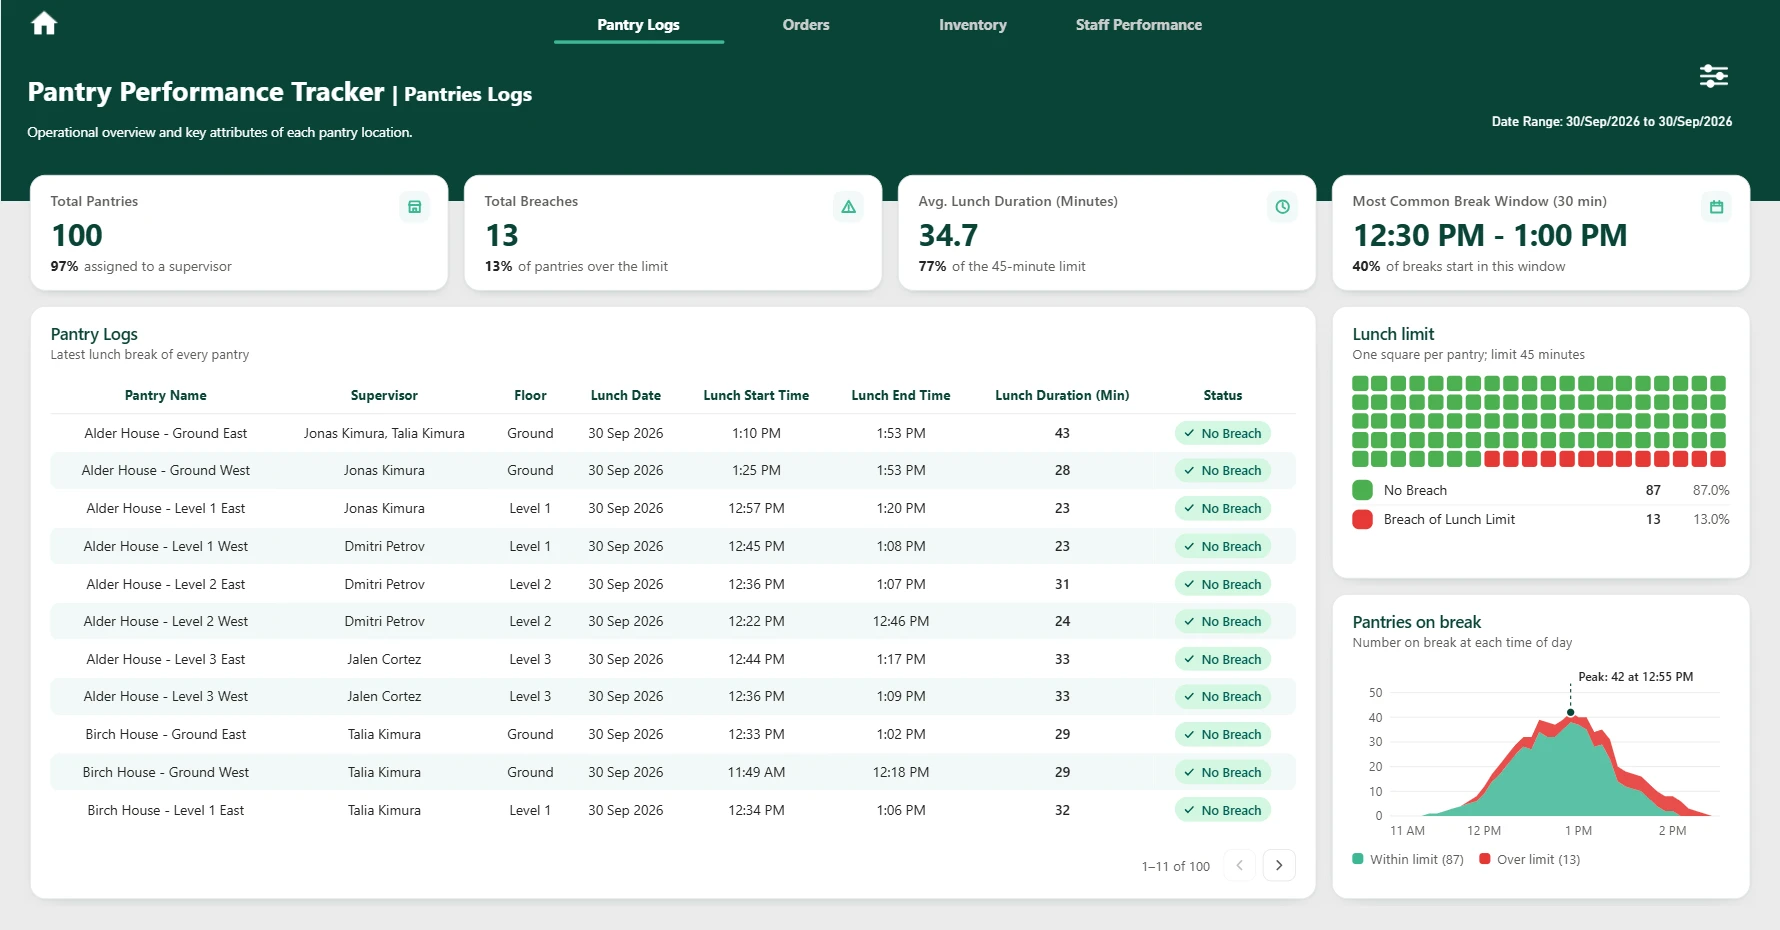
- Pantry Logs. Lunch-limit breaches, and how many pantries are on break through the day.
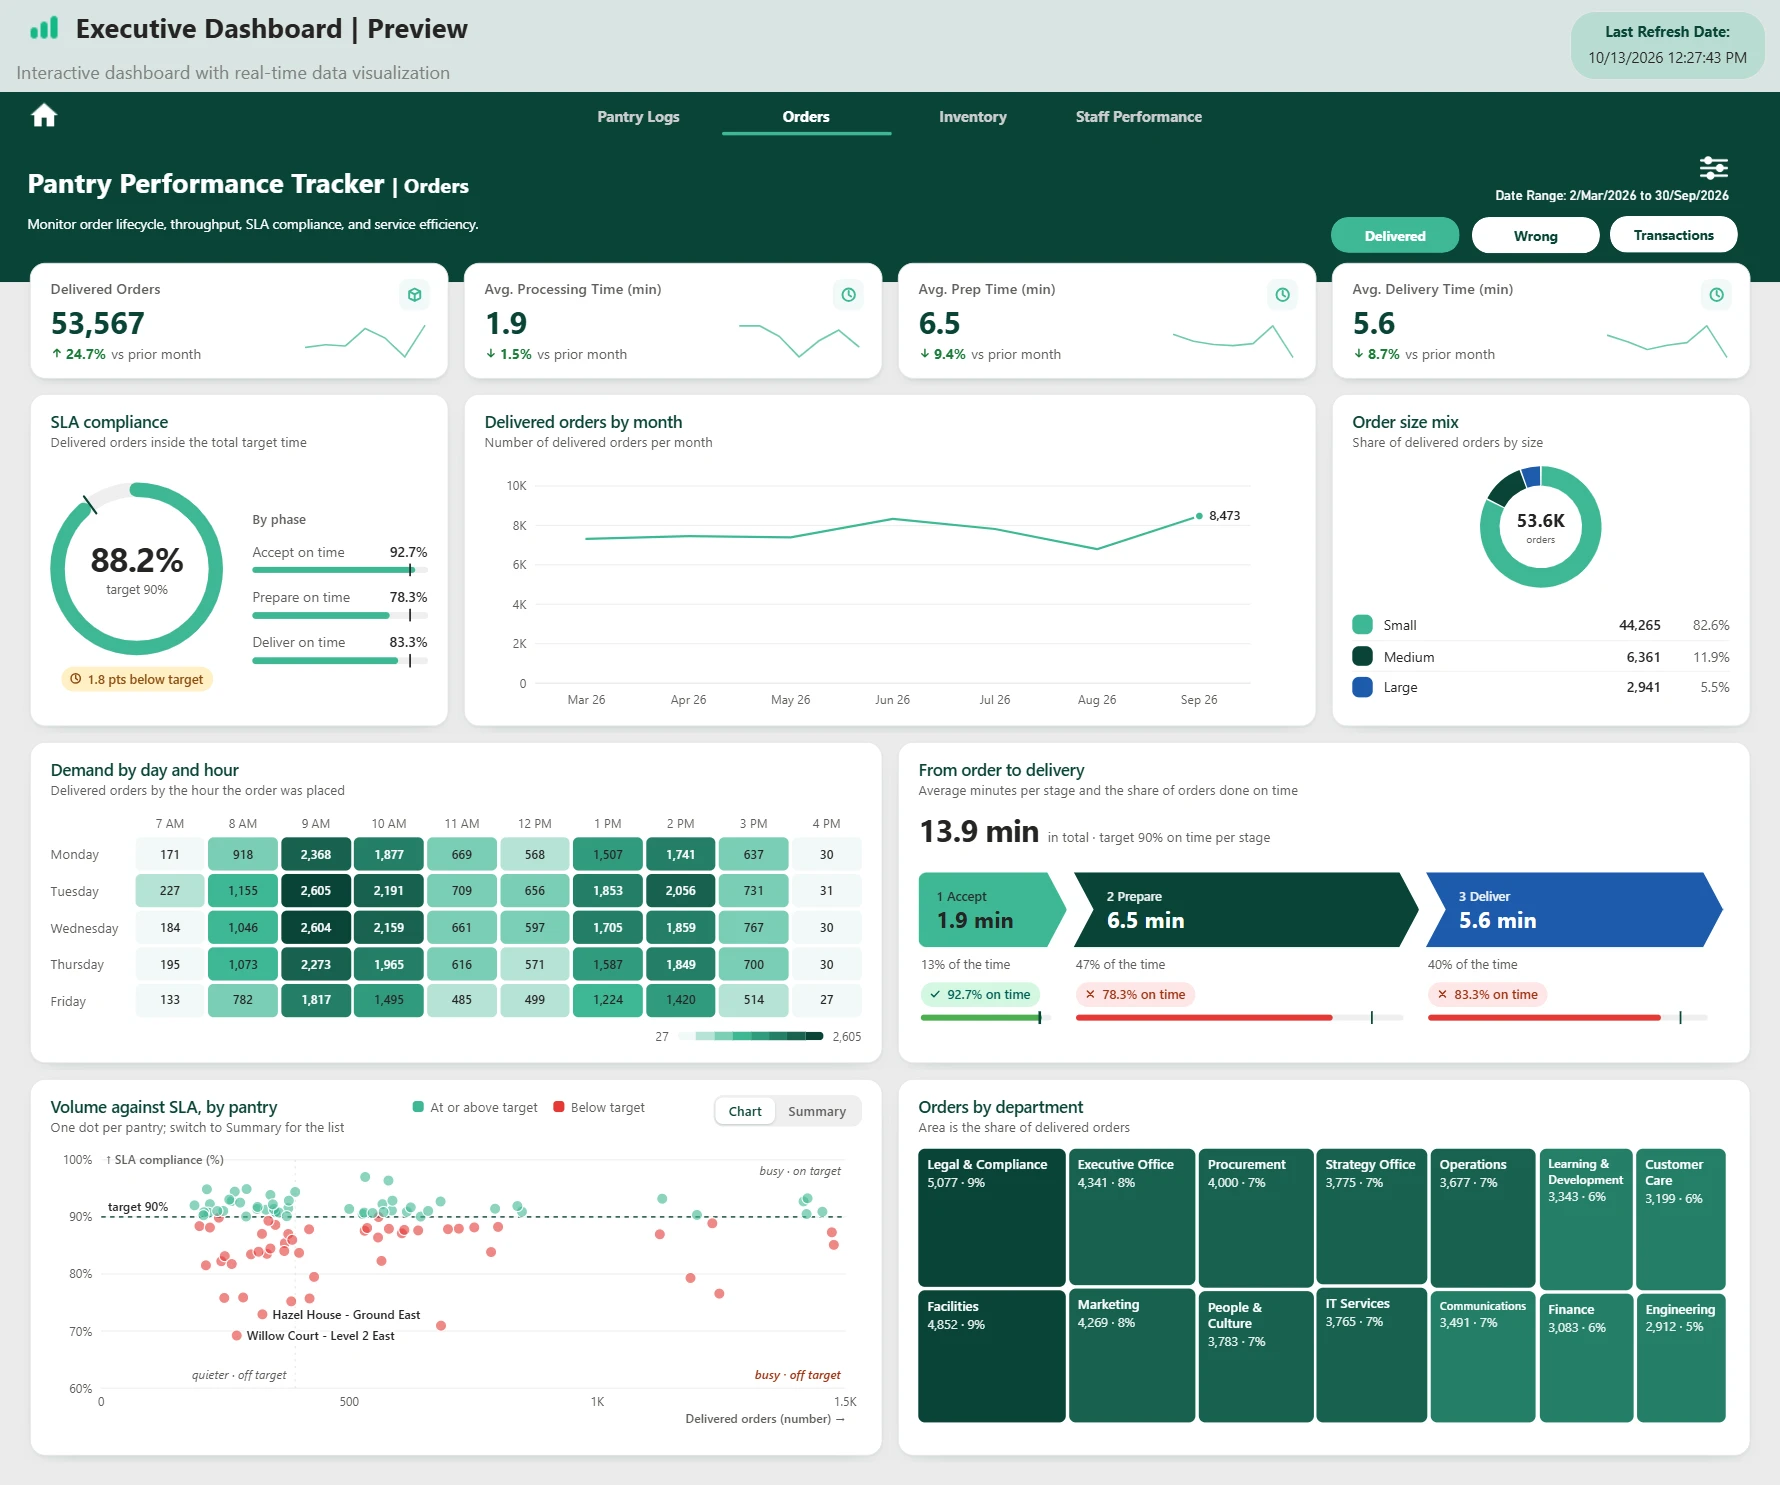
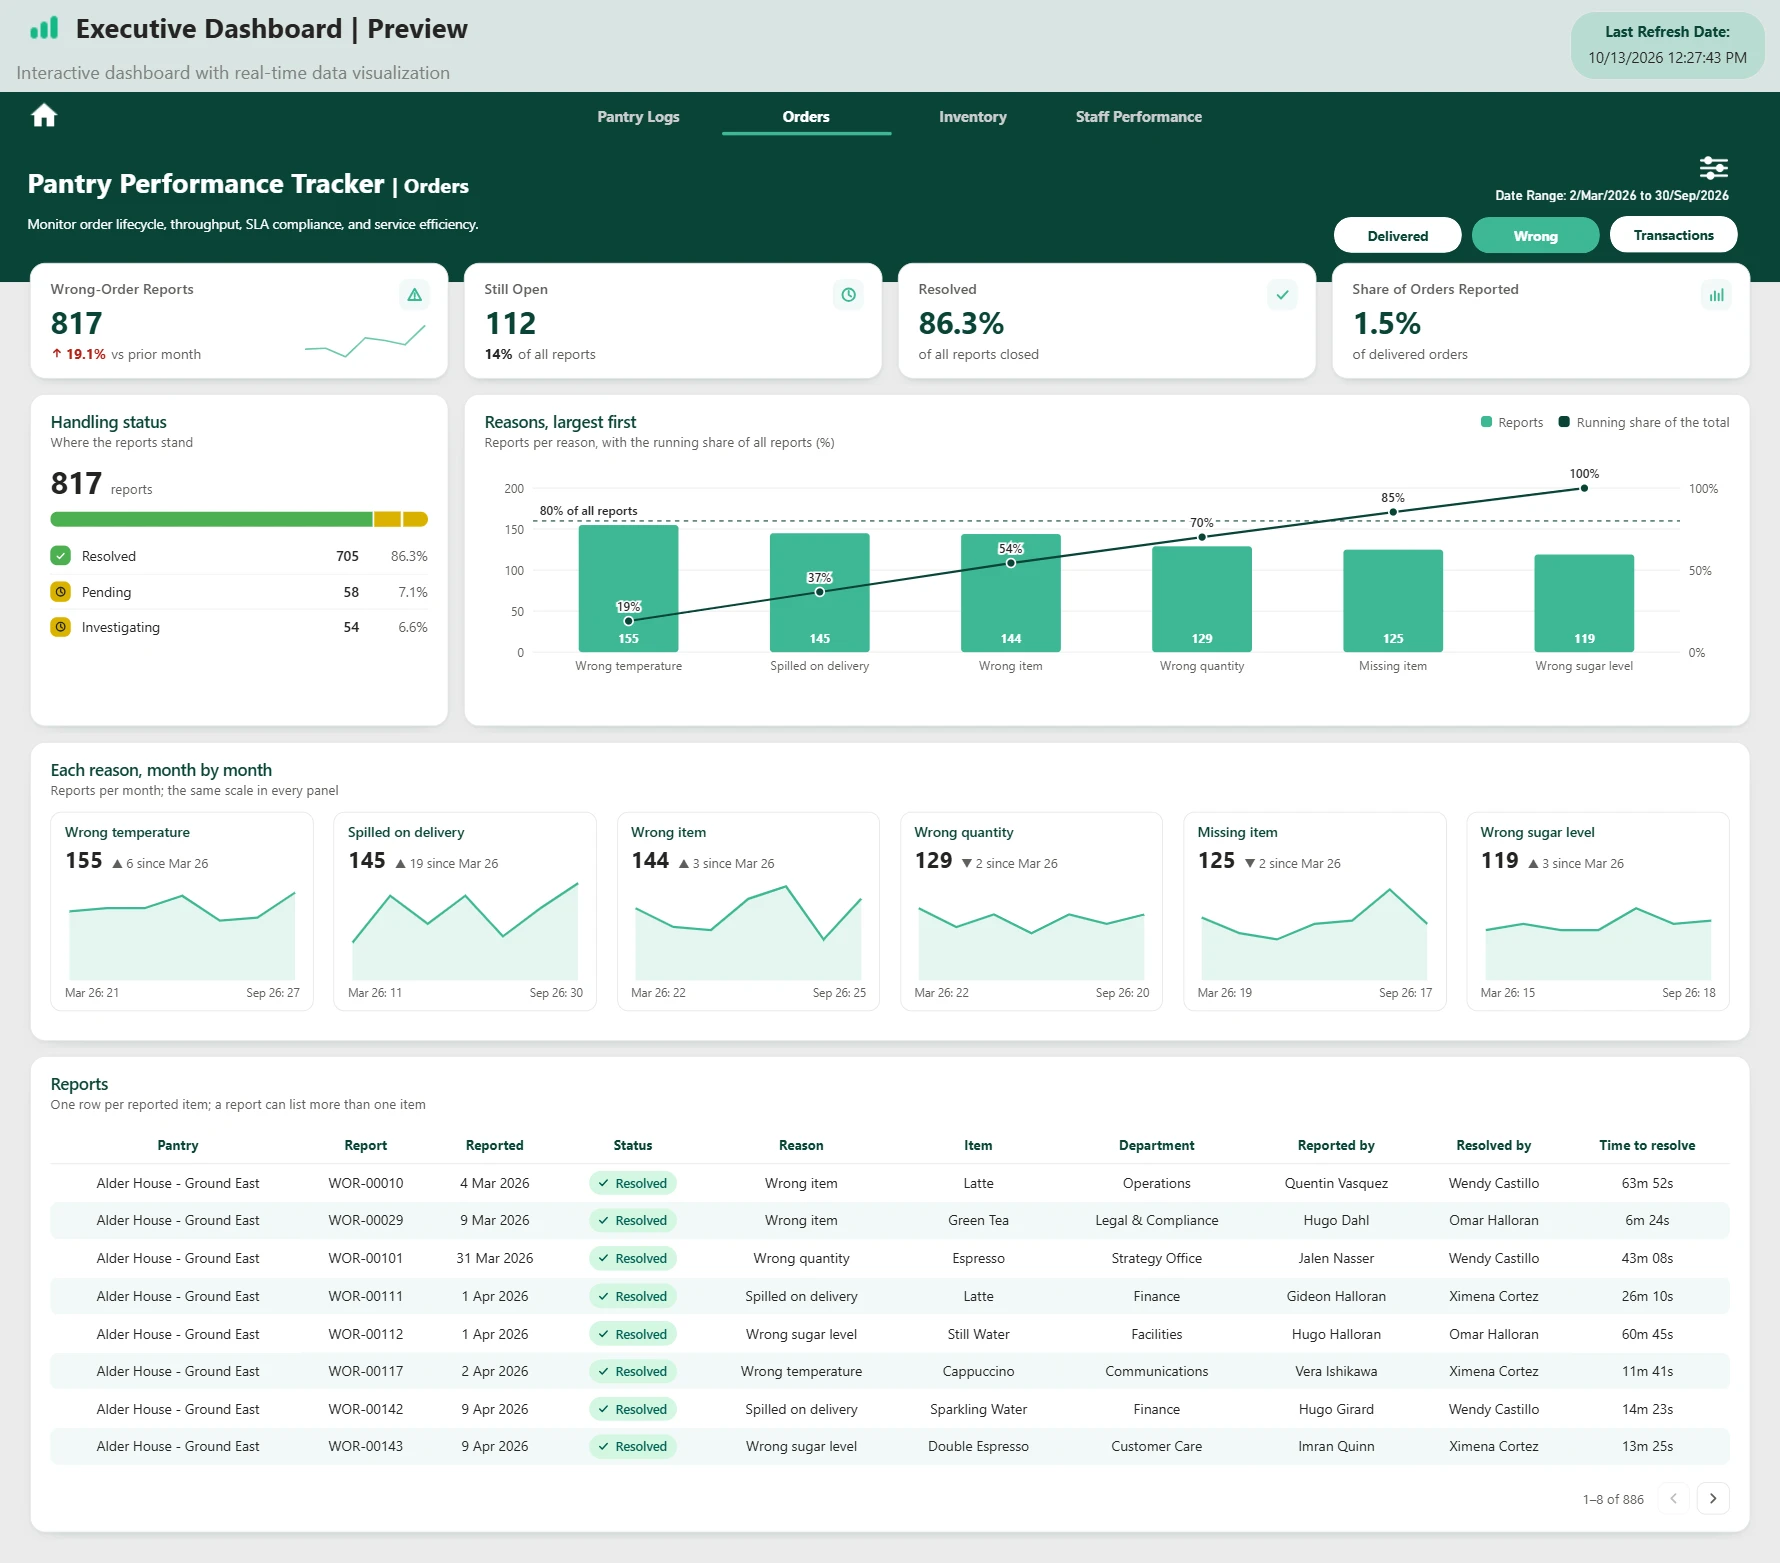
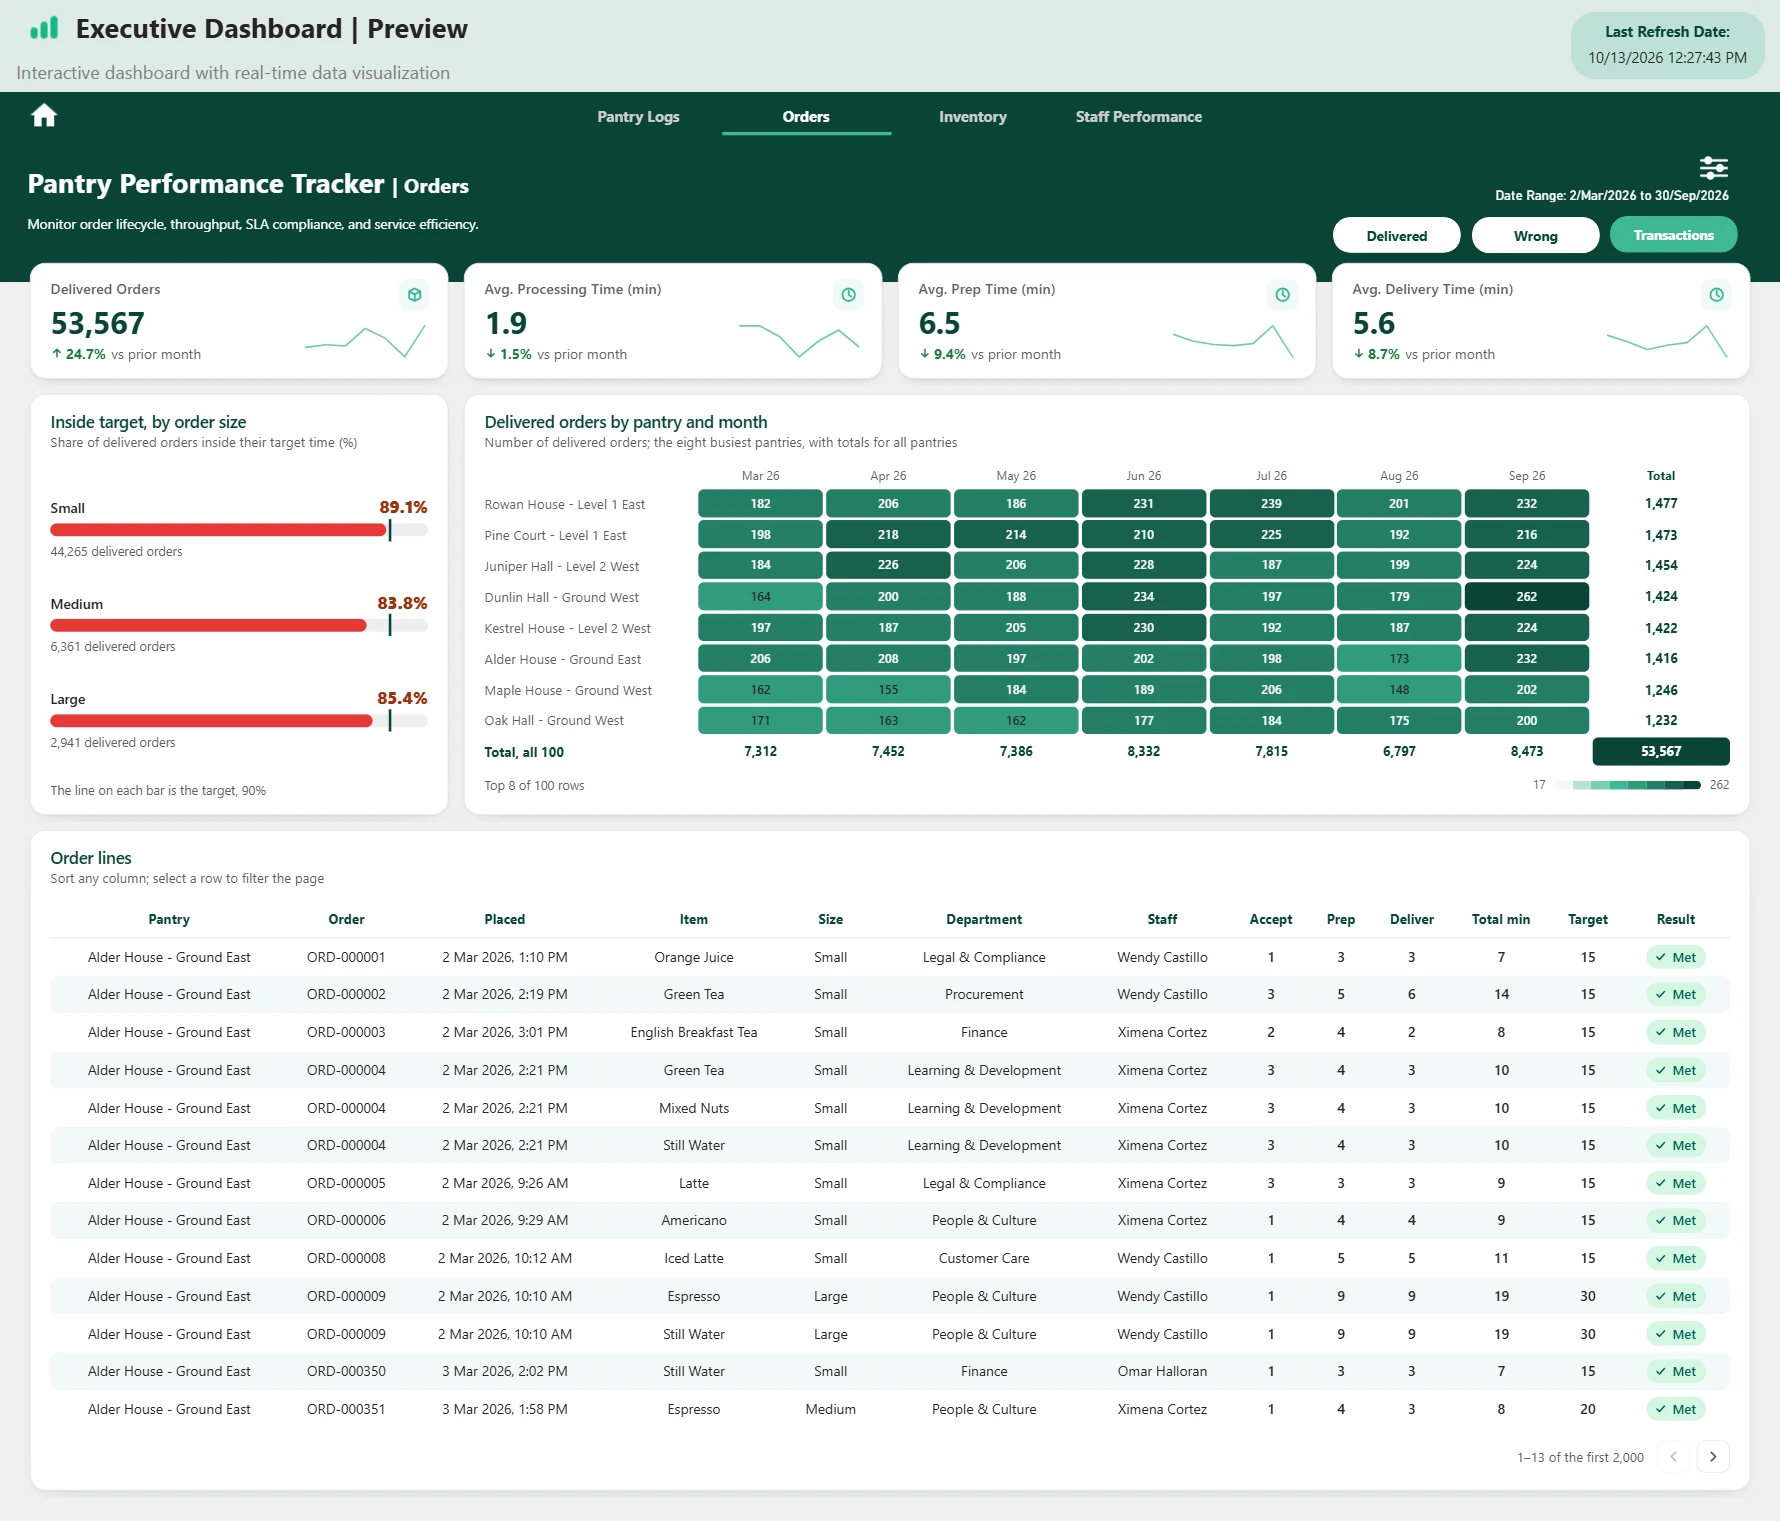
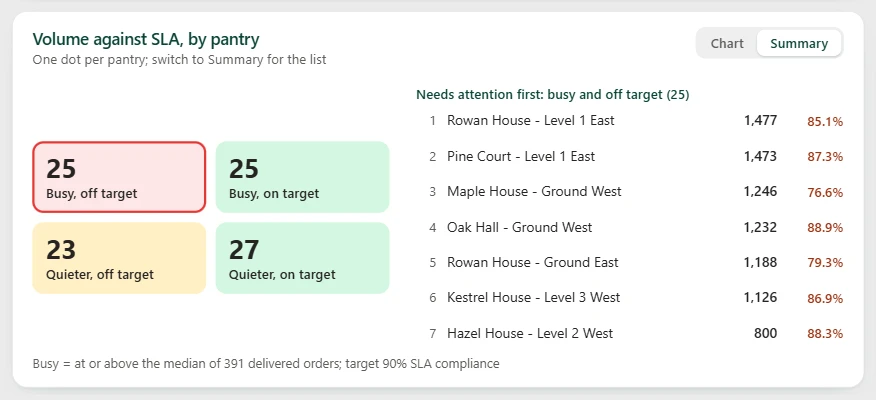
- Orders. SLA compliance by month, order size, day and hour, pantry and department, plus wrong orders and order lines.
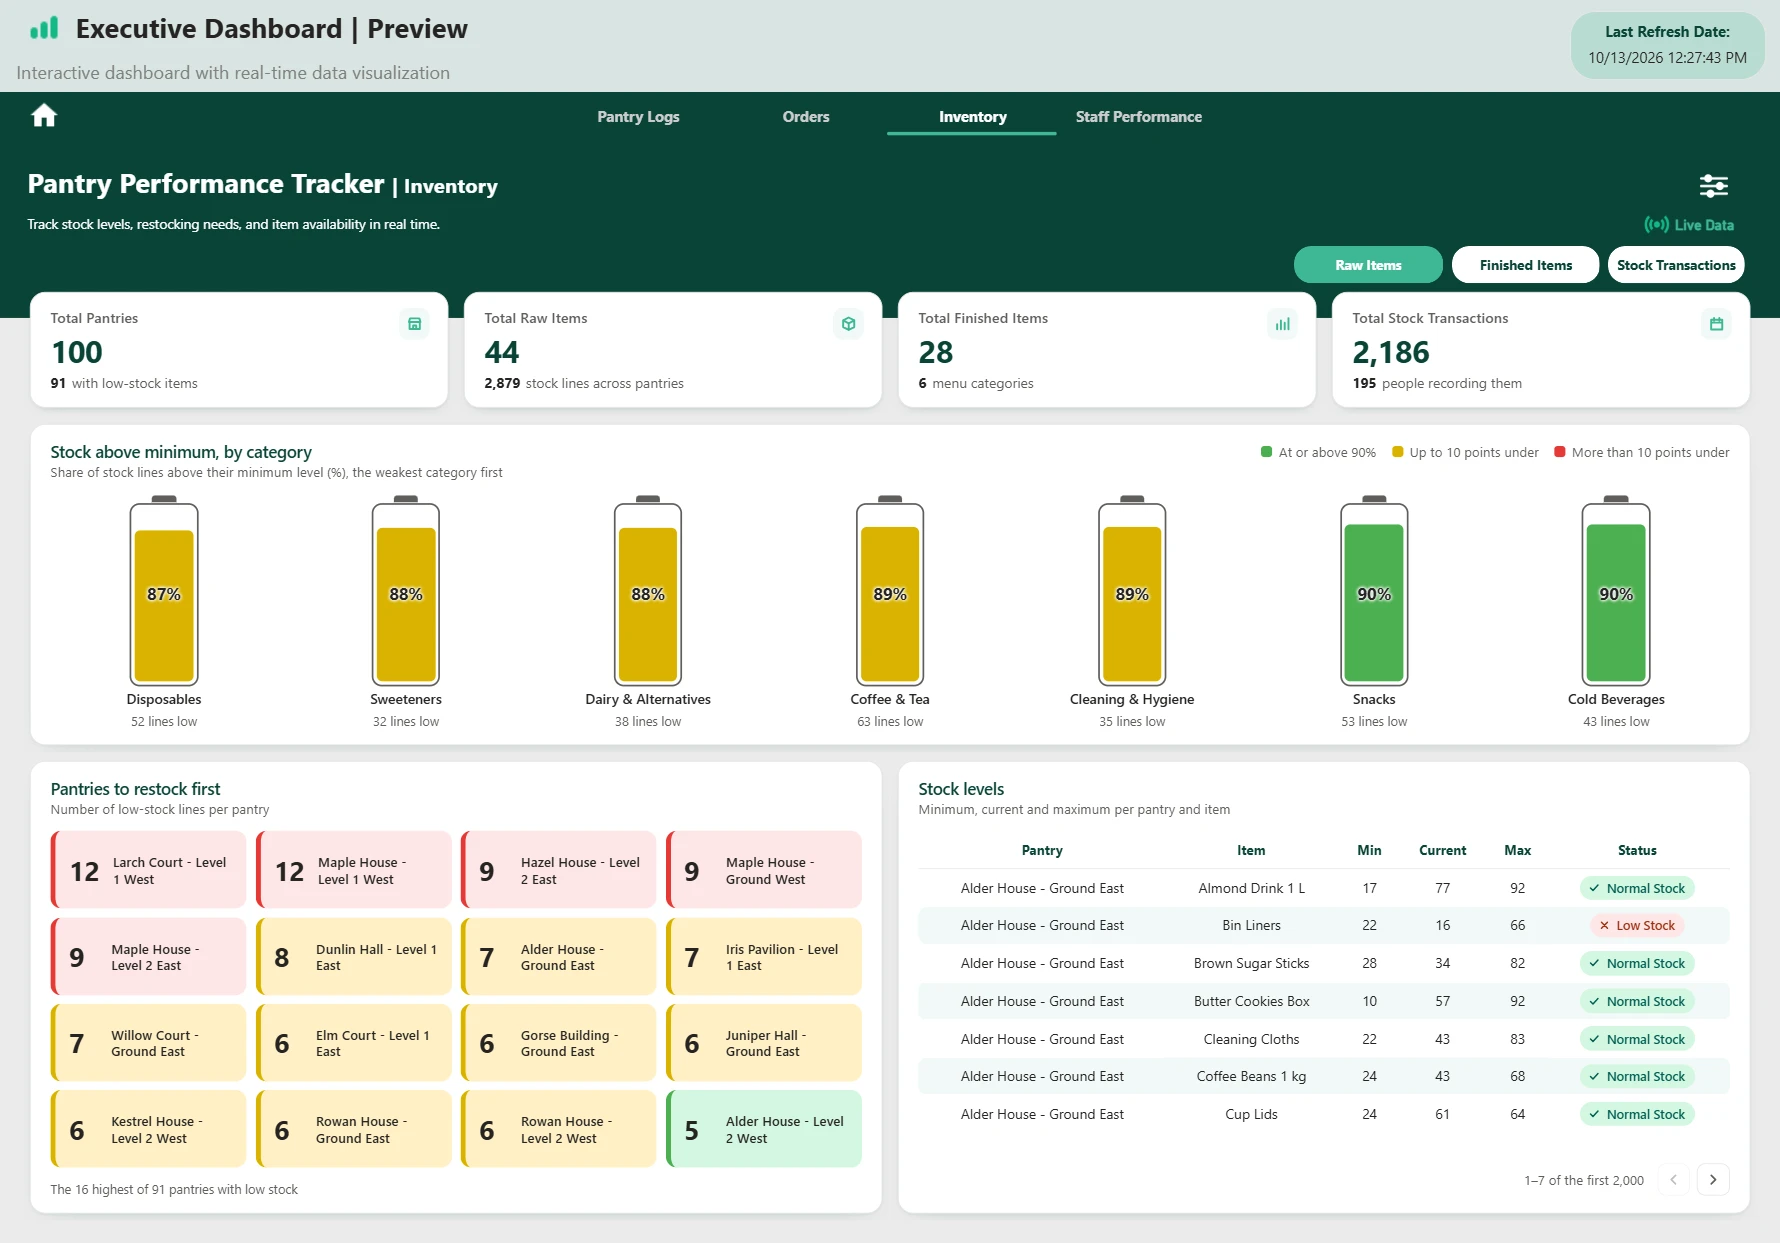
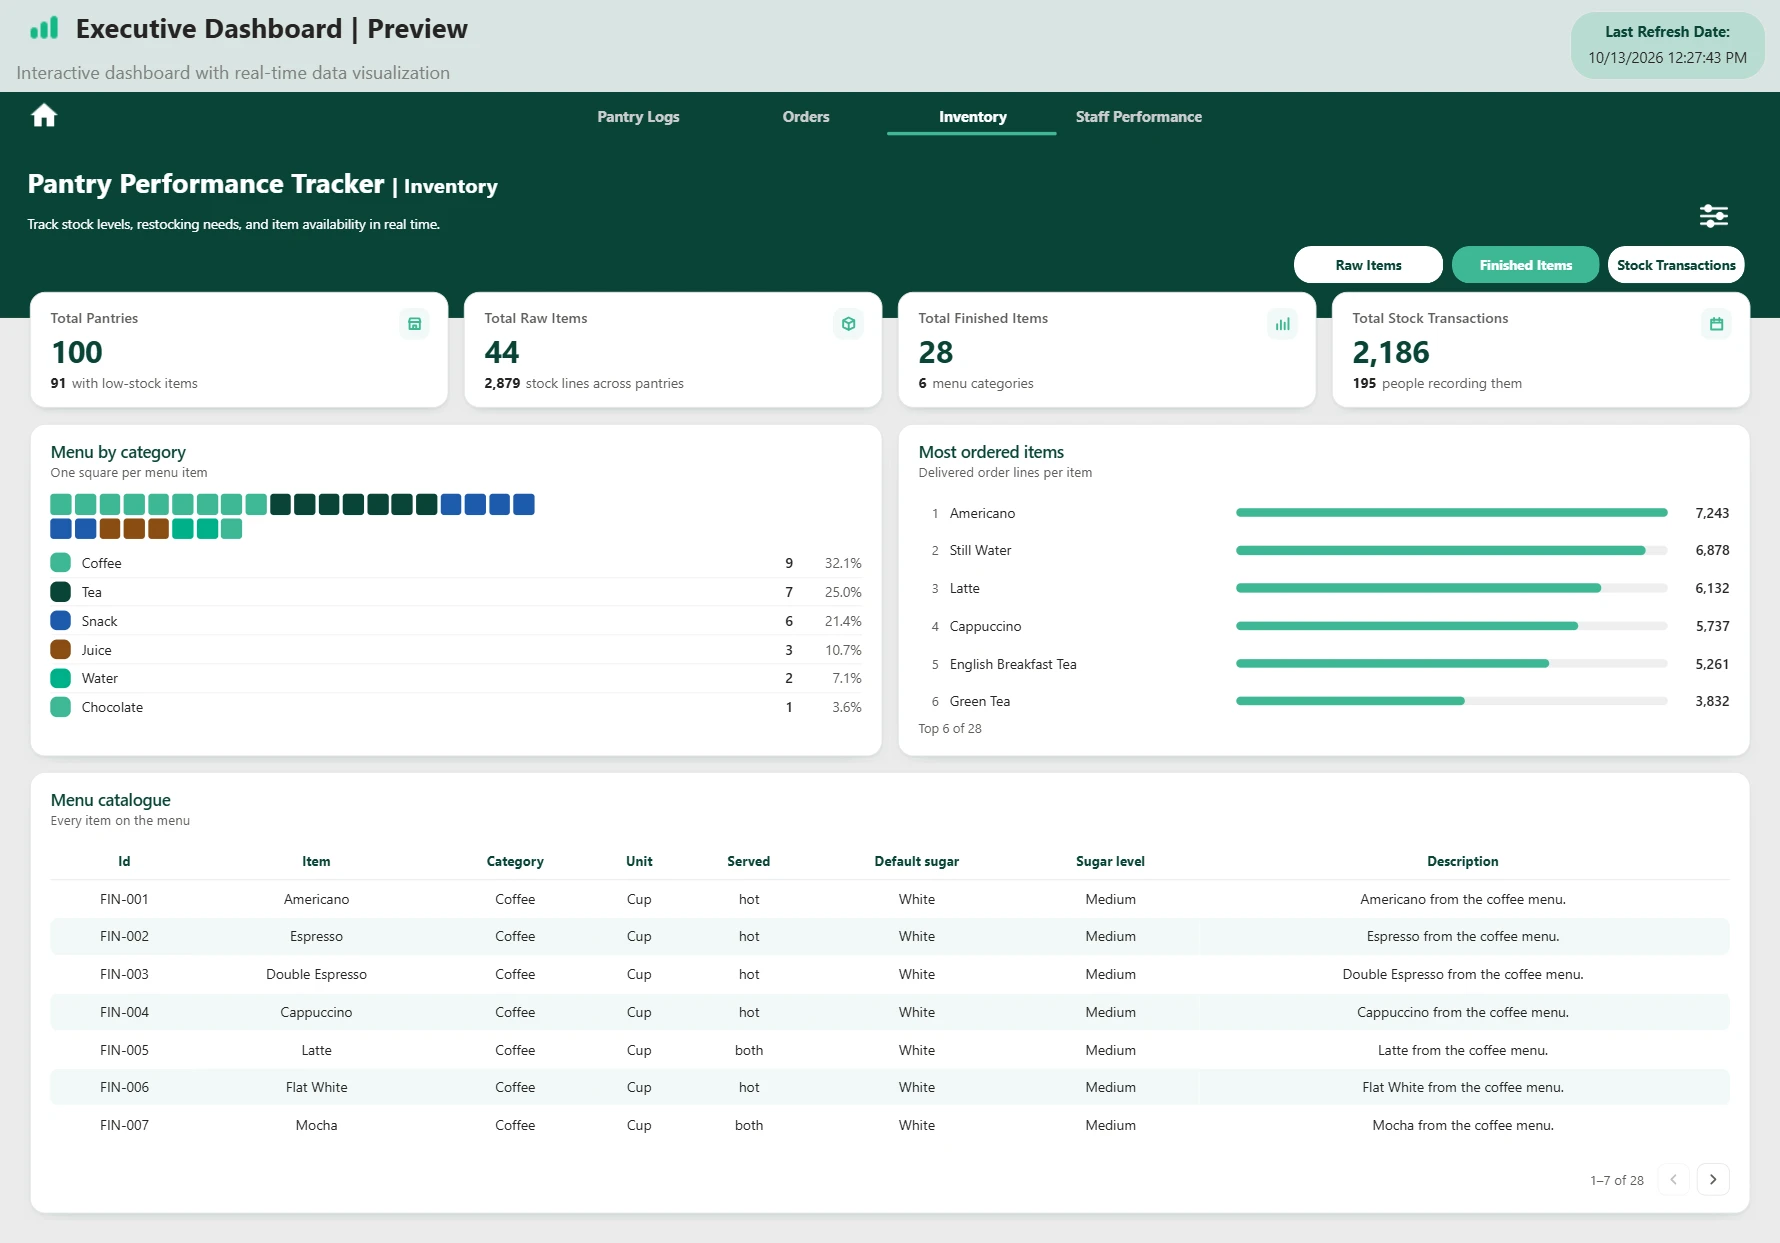
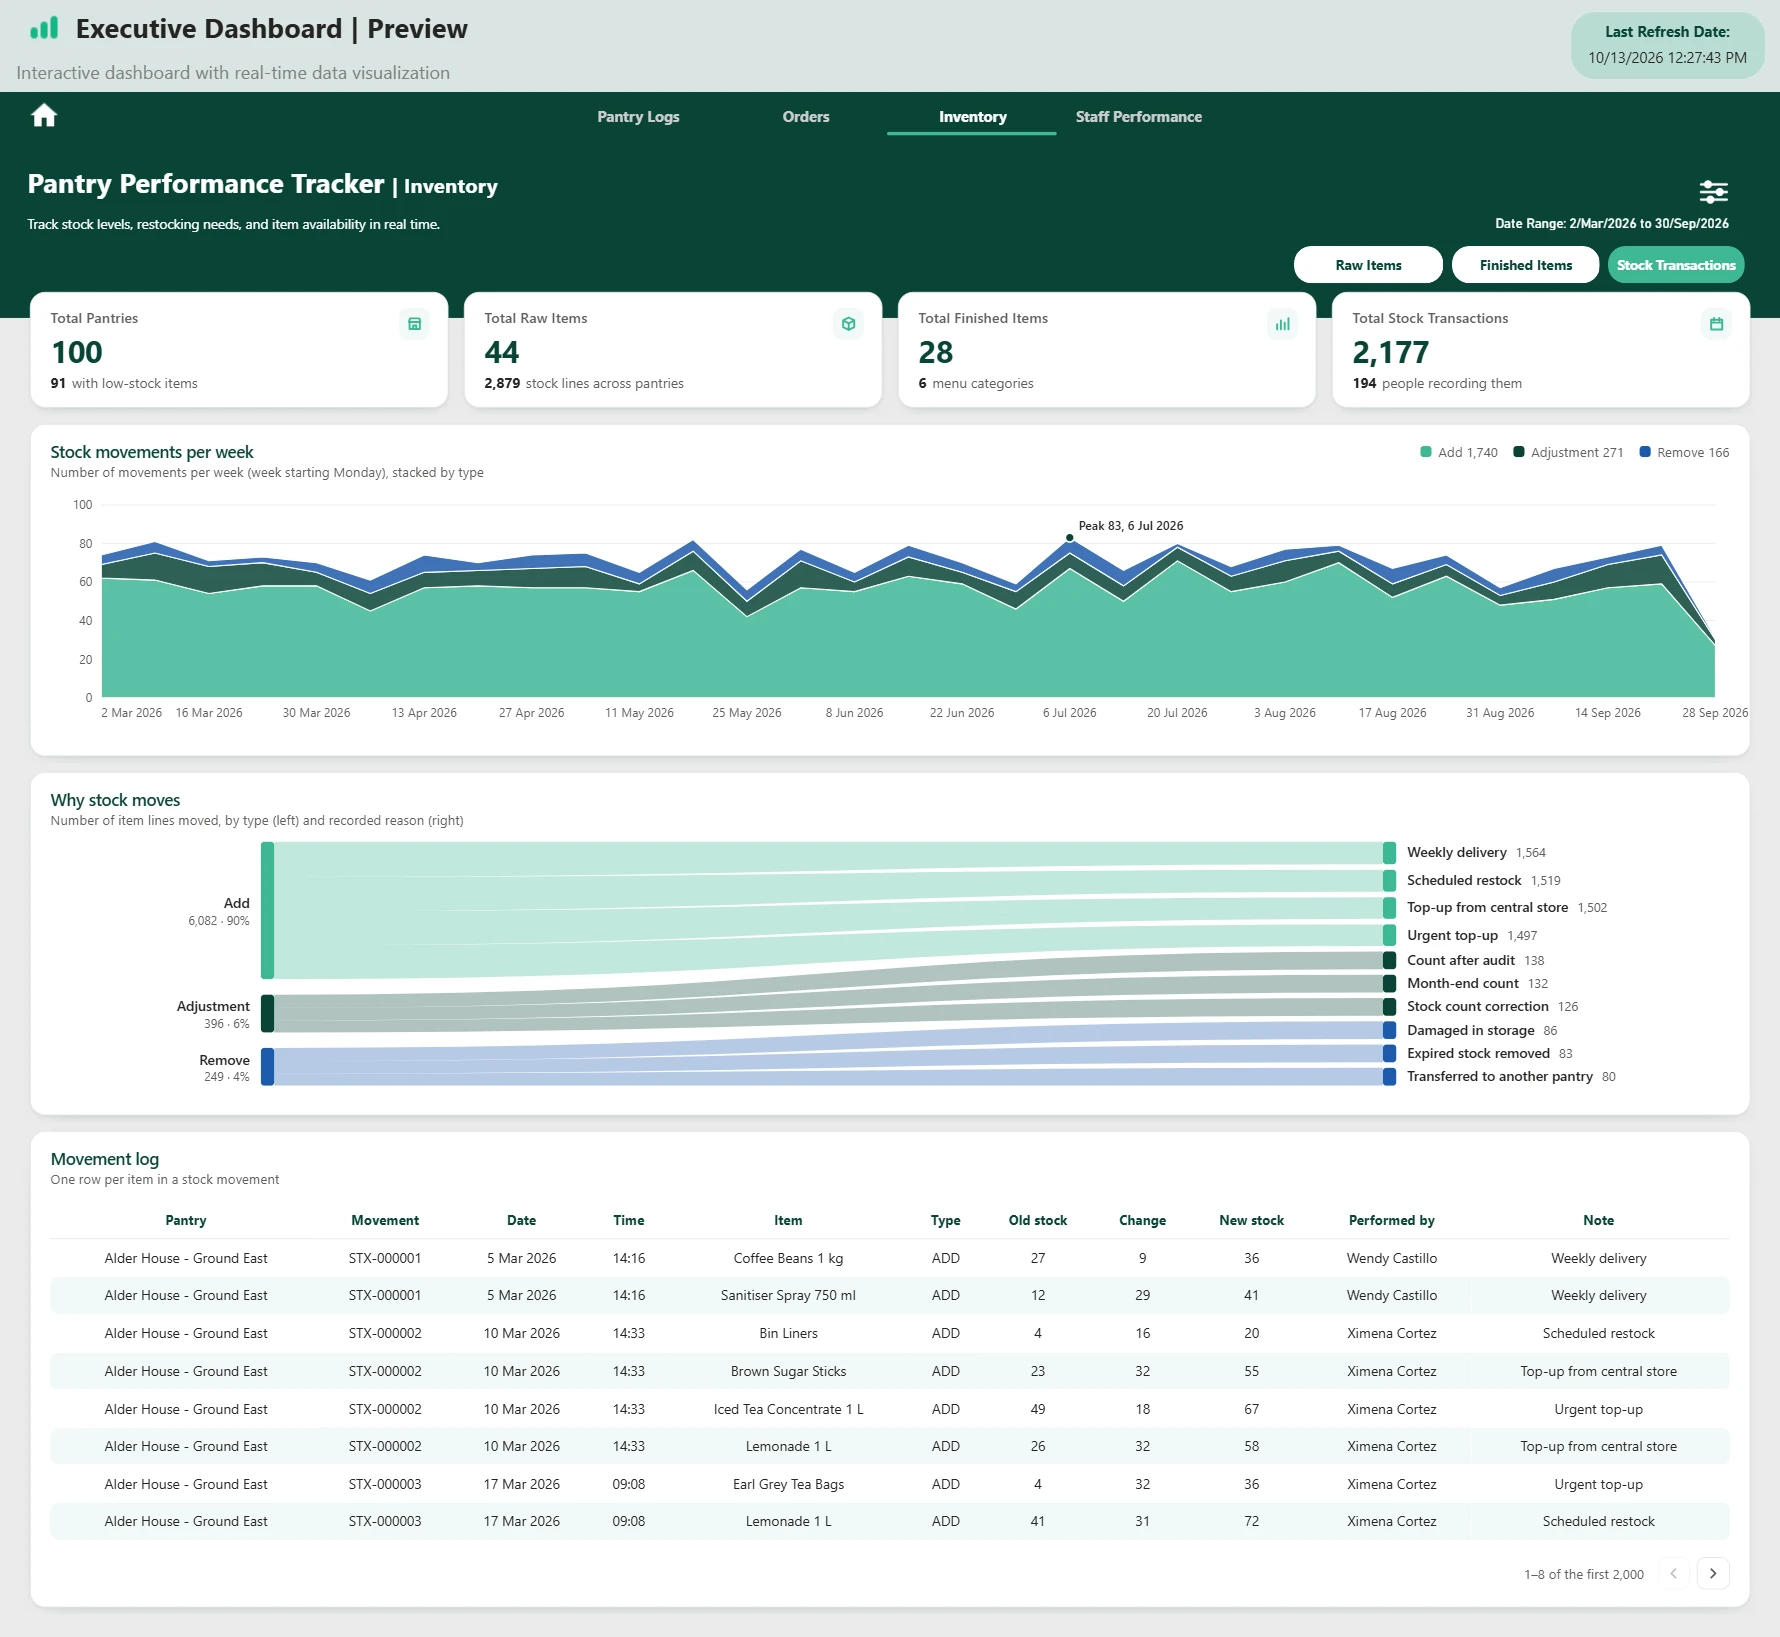
- Inventory. What to restock first, the most ordered items, and stock movements by reason.
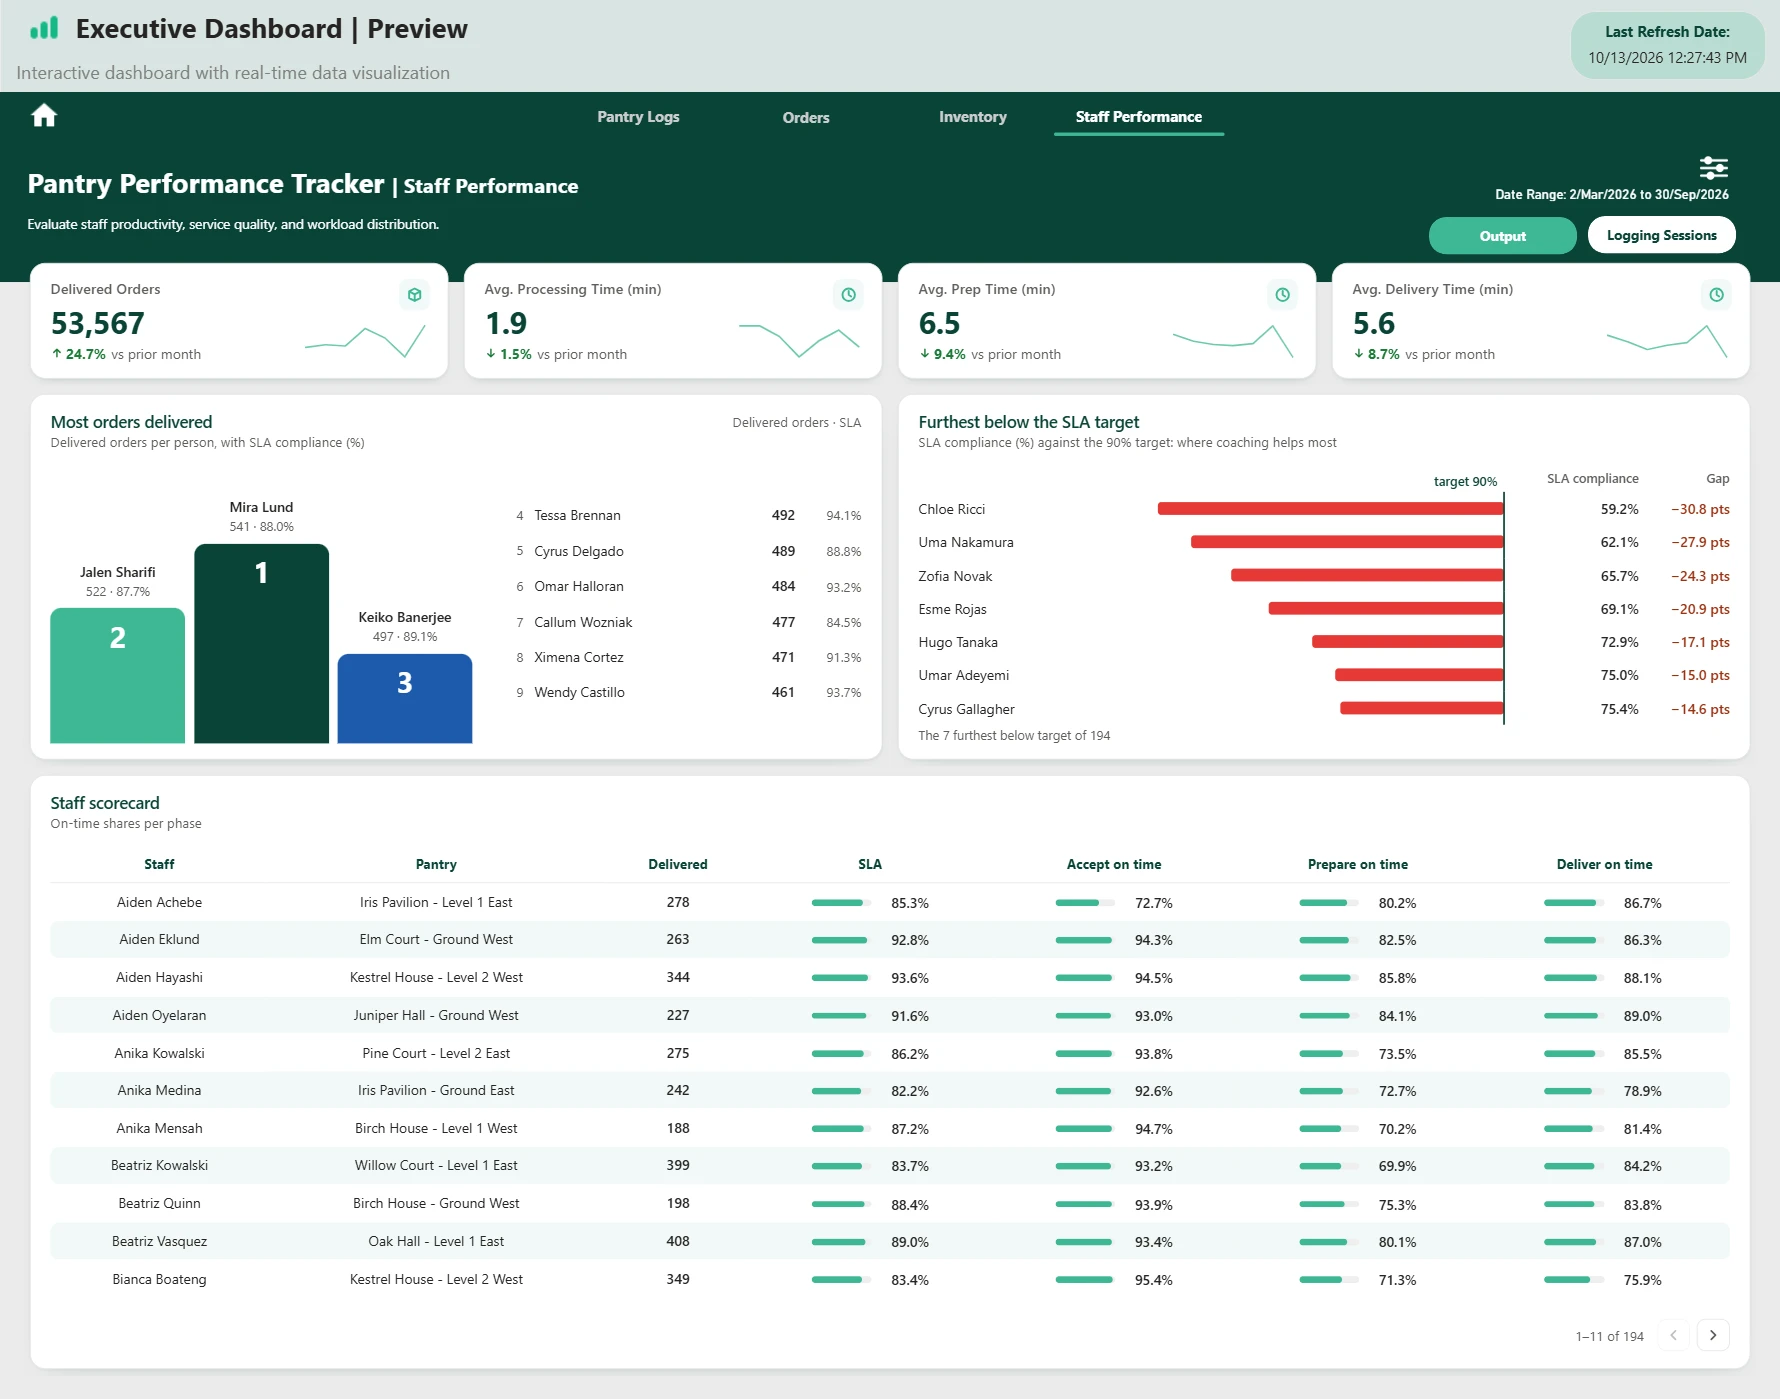
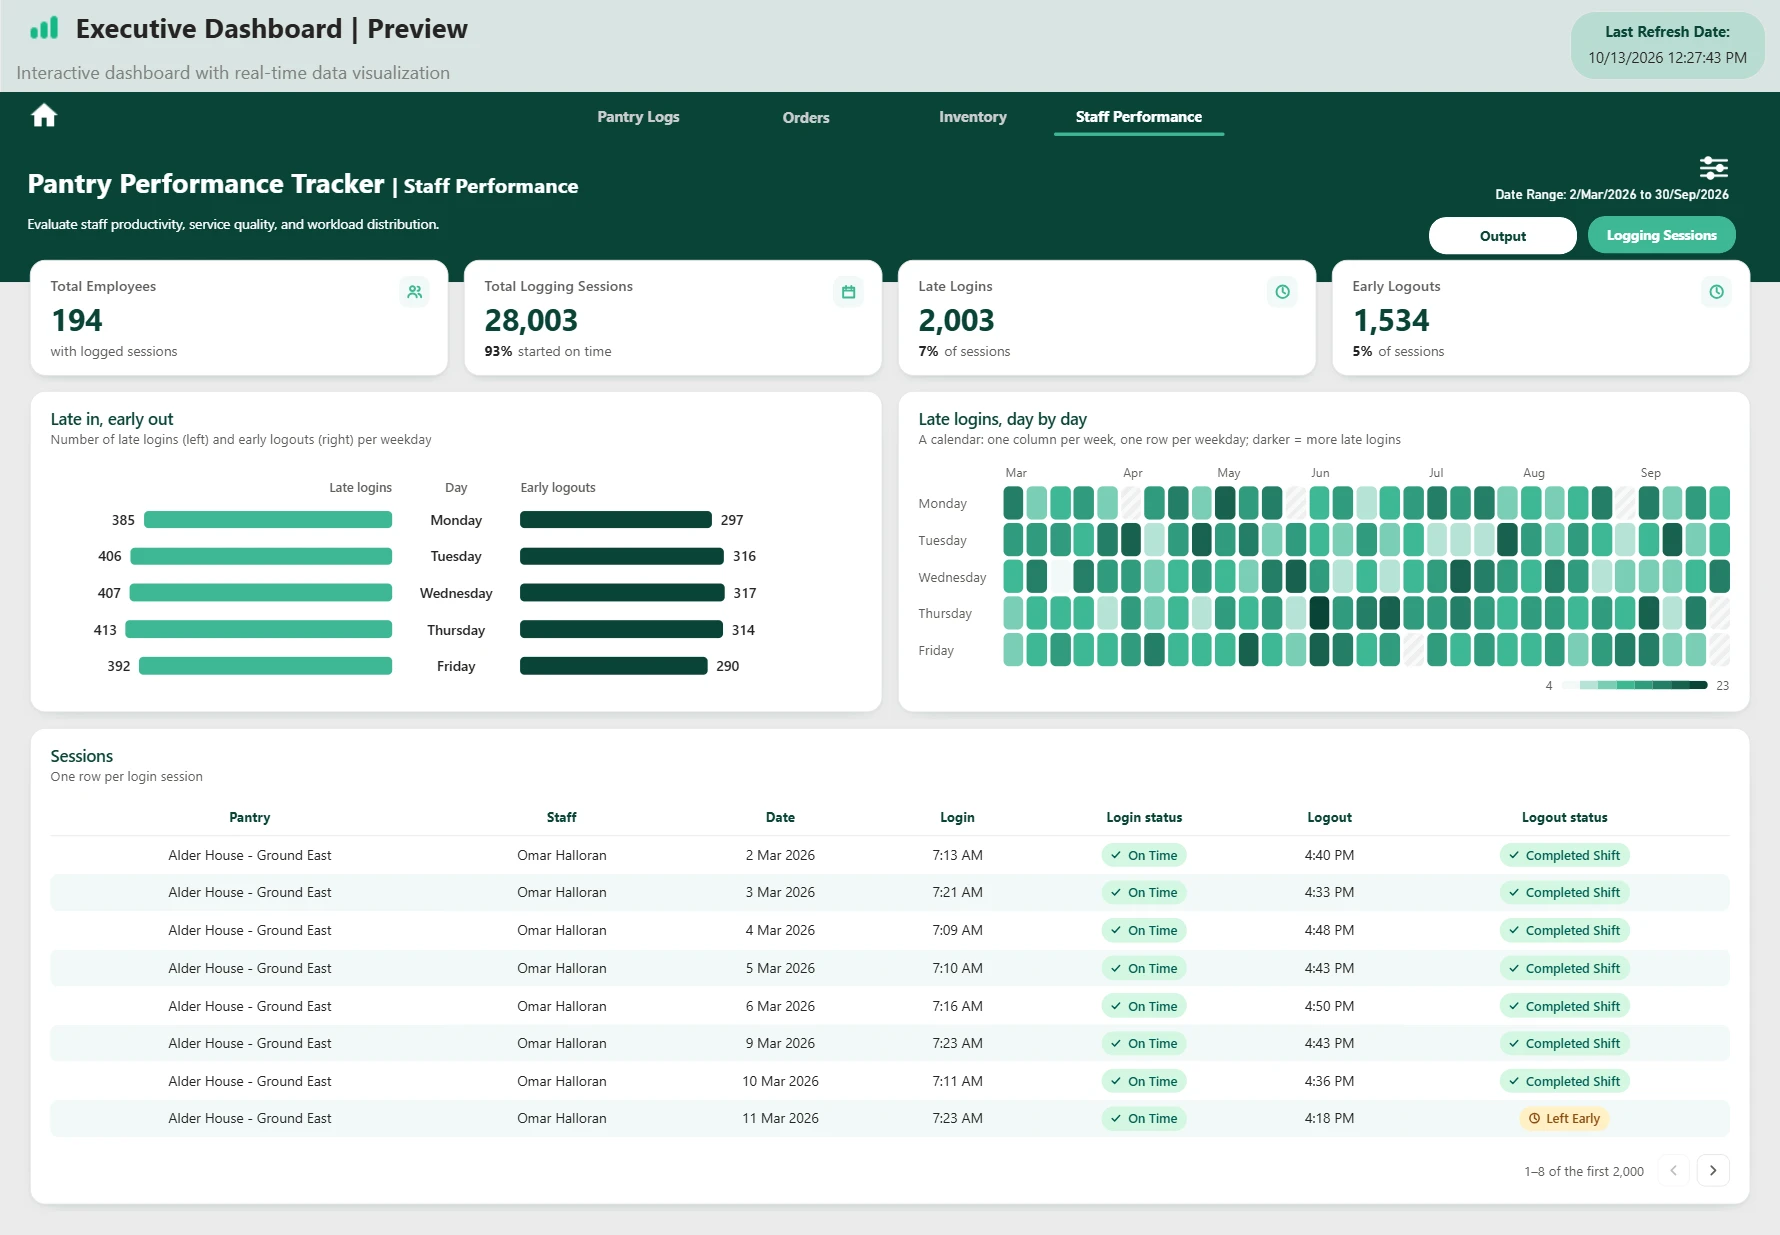
- Staff Performance. Output against the SLA target, late logins and early logouts.
- Per-user view. With no role, Pantry Logs shows 100 pantries. Viewed as one supervisor, it shows 8.