Project 2.1
Service Desk Analytics
Executive and operational Power BI dashboards for four public-sector service desks, all on one Microsoft Fabric data model.
- public-sector service desks
- 4
- DAX measures
- 55
1Walkthrough and screens
Recorded in Power BI Desktop's editing view, so small hover icons and a selection outline appear in the videos.
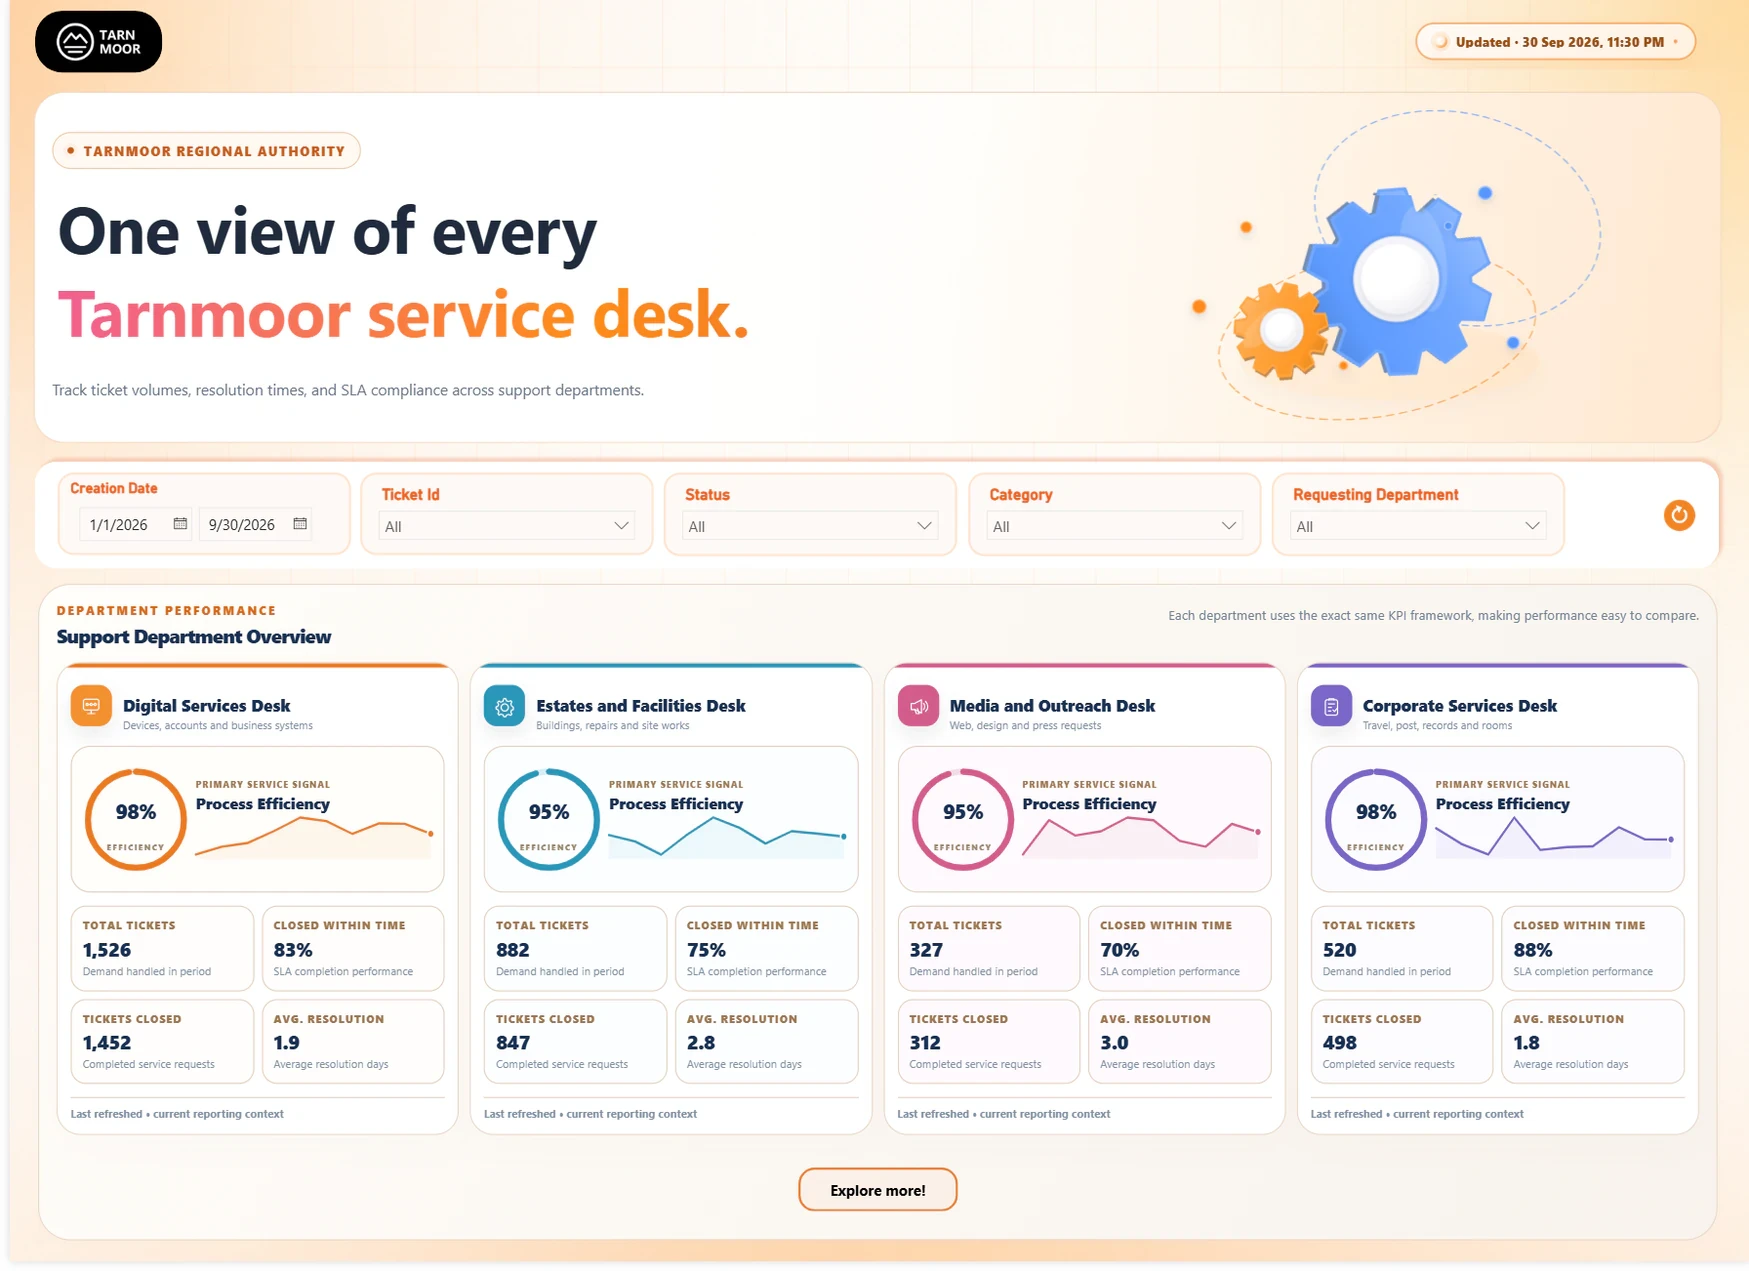 Open at full size
 Open at full size
 Open at full size
2The problem
Four public-sector service desks needed SLA compliance, backlog and resolution time reported the same way, for executives and for the teams who run the desks.
3What I built
I designed executive and operational Power BI dashboards for the four desks, all on one Microsoft Fabric data model, so every page and every desk uses the same definitions. The original model has 55 DAX measures.
The demo copy has three pages. I rewrote its data model and its 46 measures for the demo.
4How it works
- Microsoft Fabric. One data model shared by all four desks.
- Power BI. Executive and operational dashboards, with custom visuals.
- DAX. 55 measures for SLA compliance, backlog and resolution time.
5What it shows
- Landing page. The same KPI card for each desk, so the desks are easy to compare.
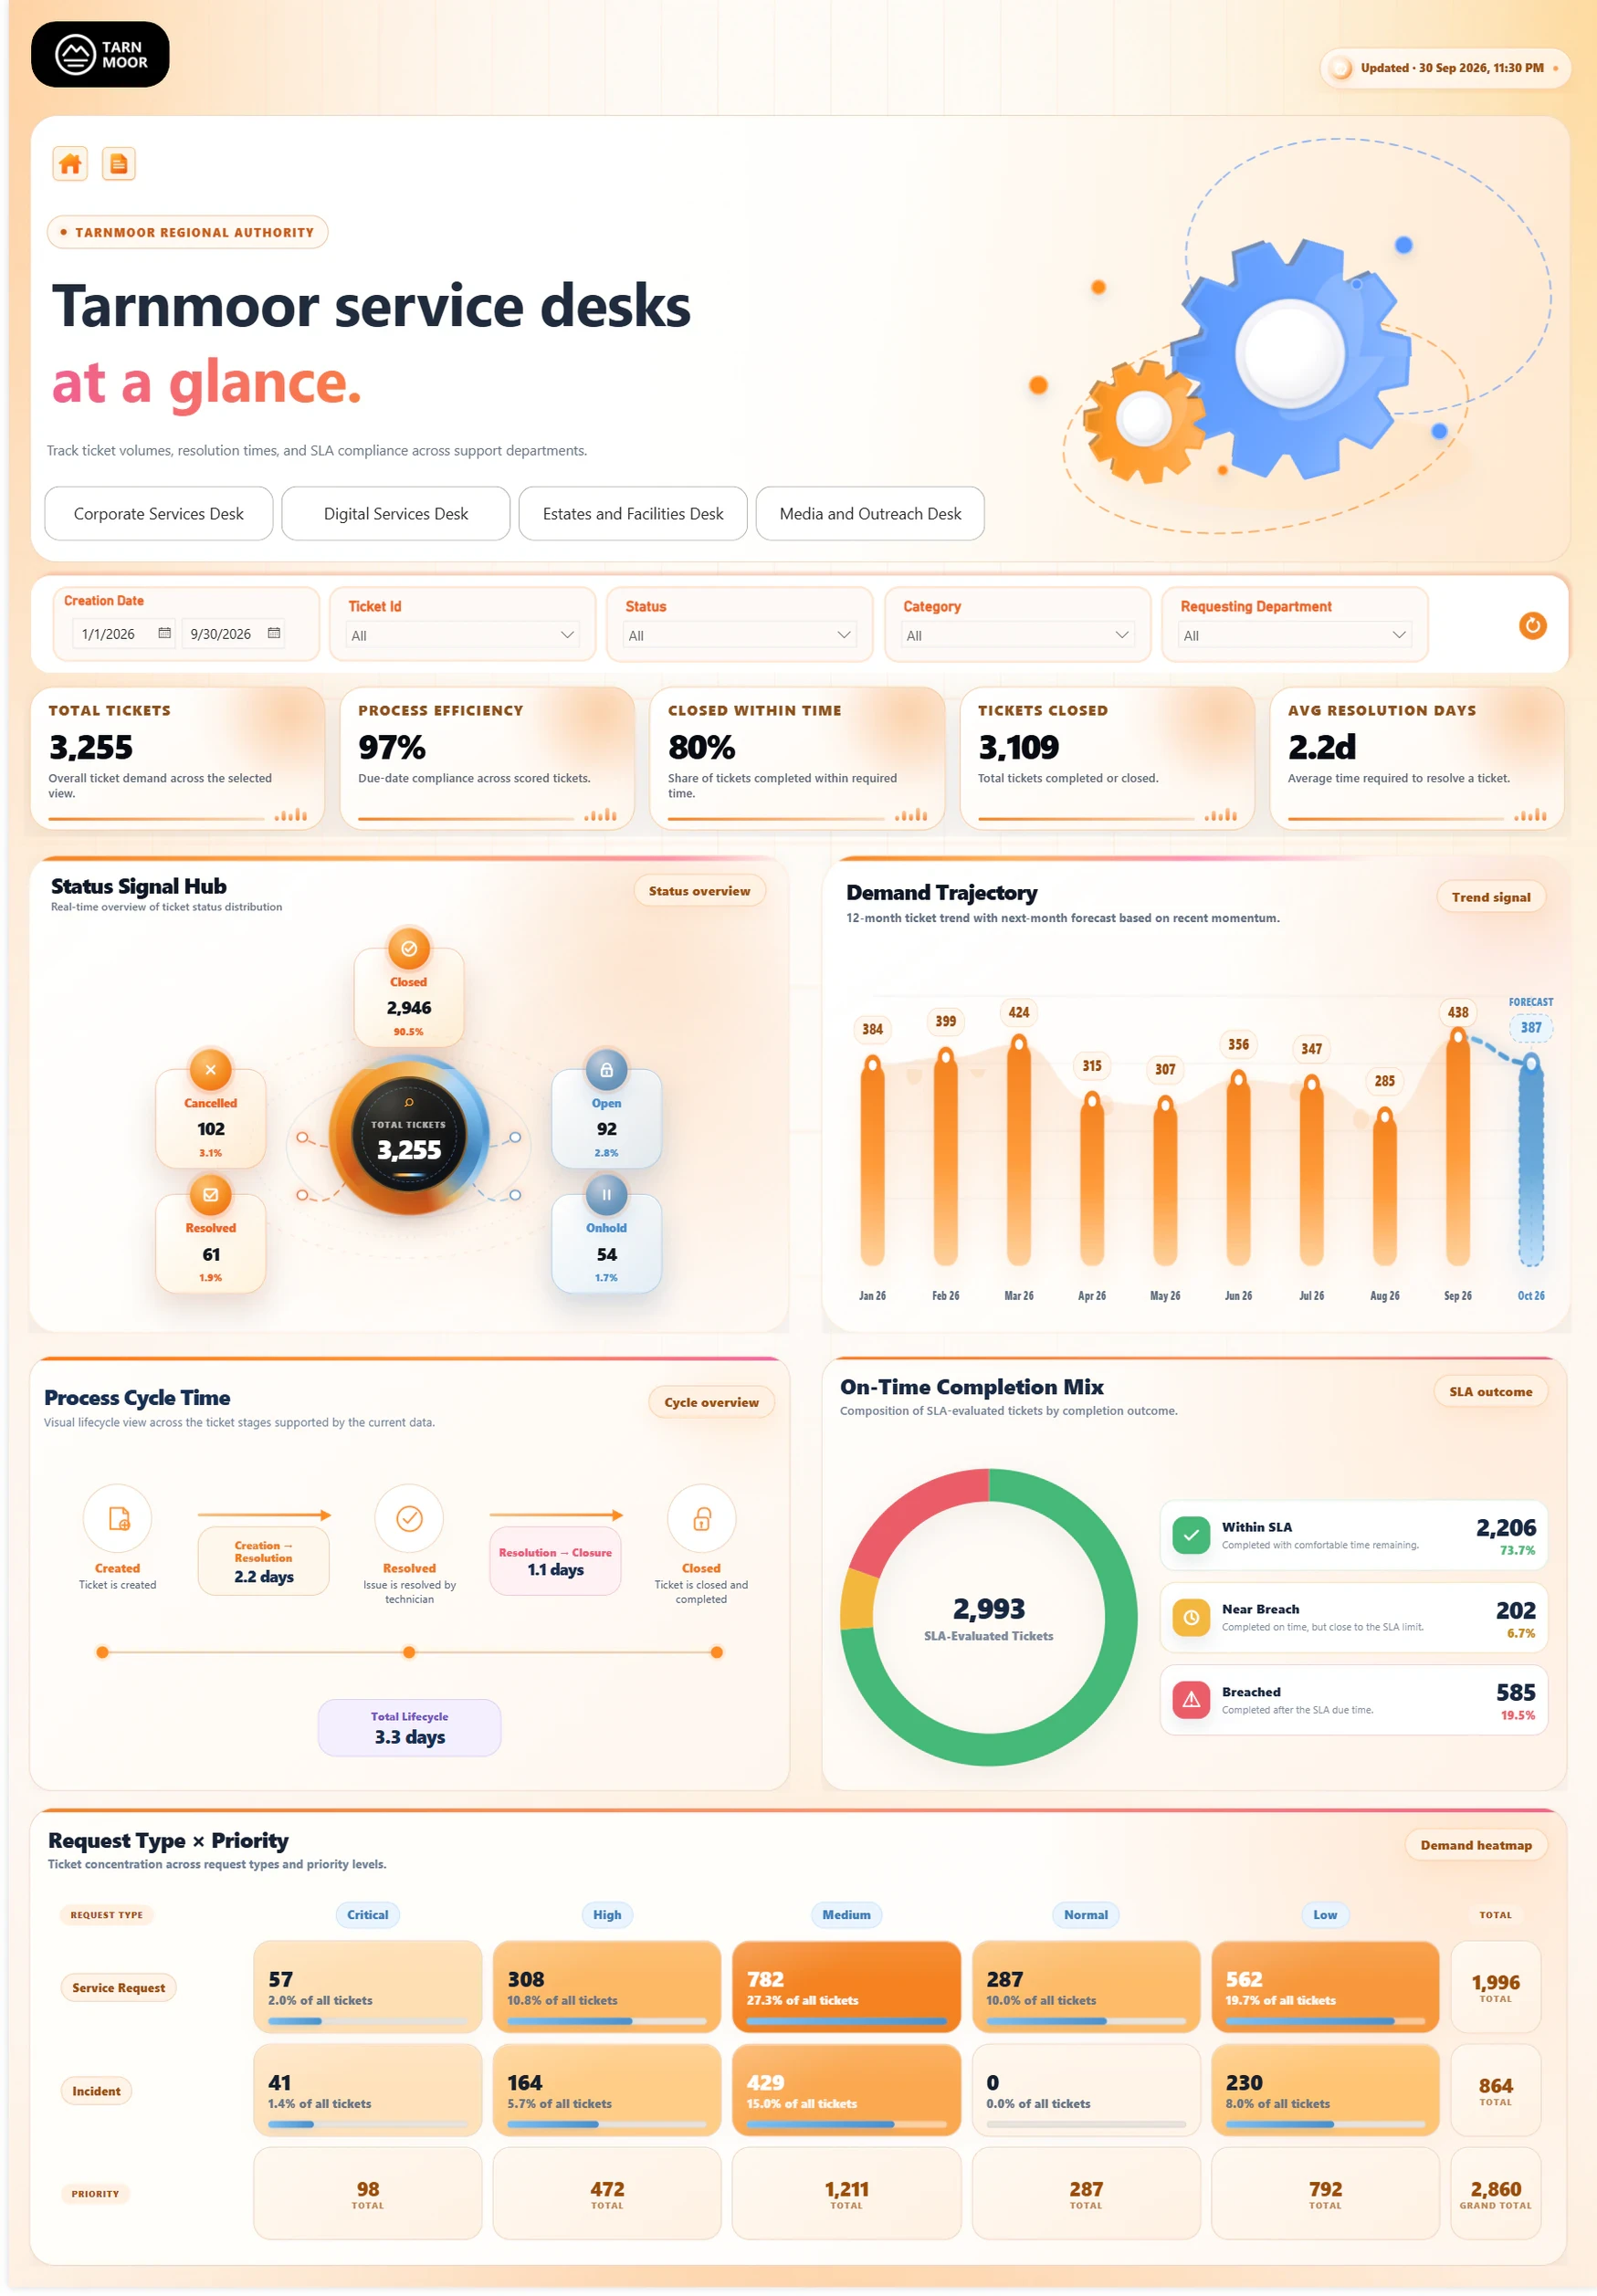
- Tickets overview. Status, monthly demand, cycle time by stage, on-time completion and a request type by priority heatmap.
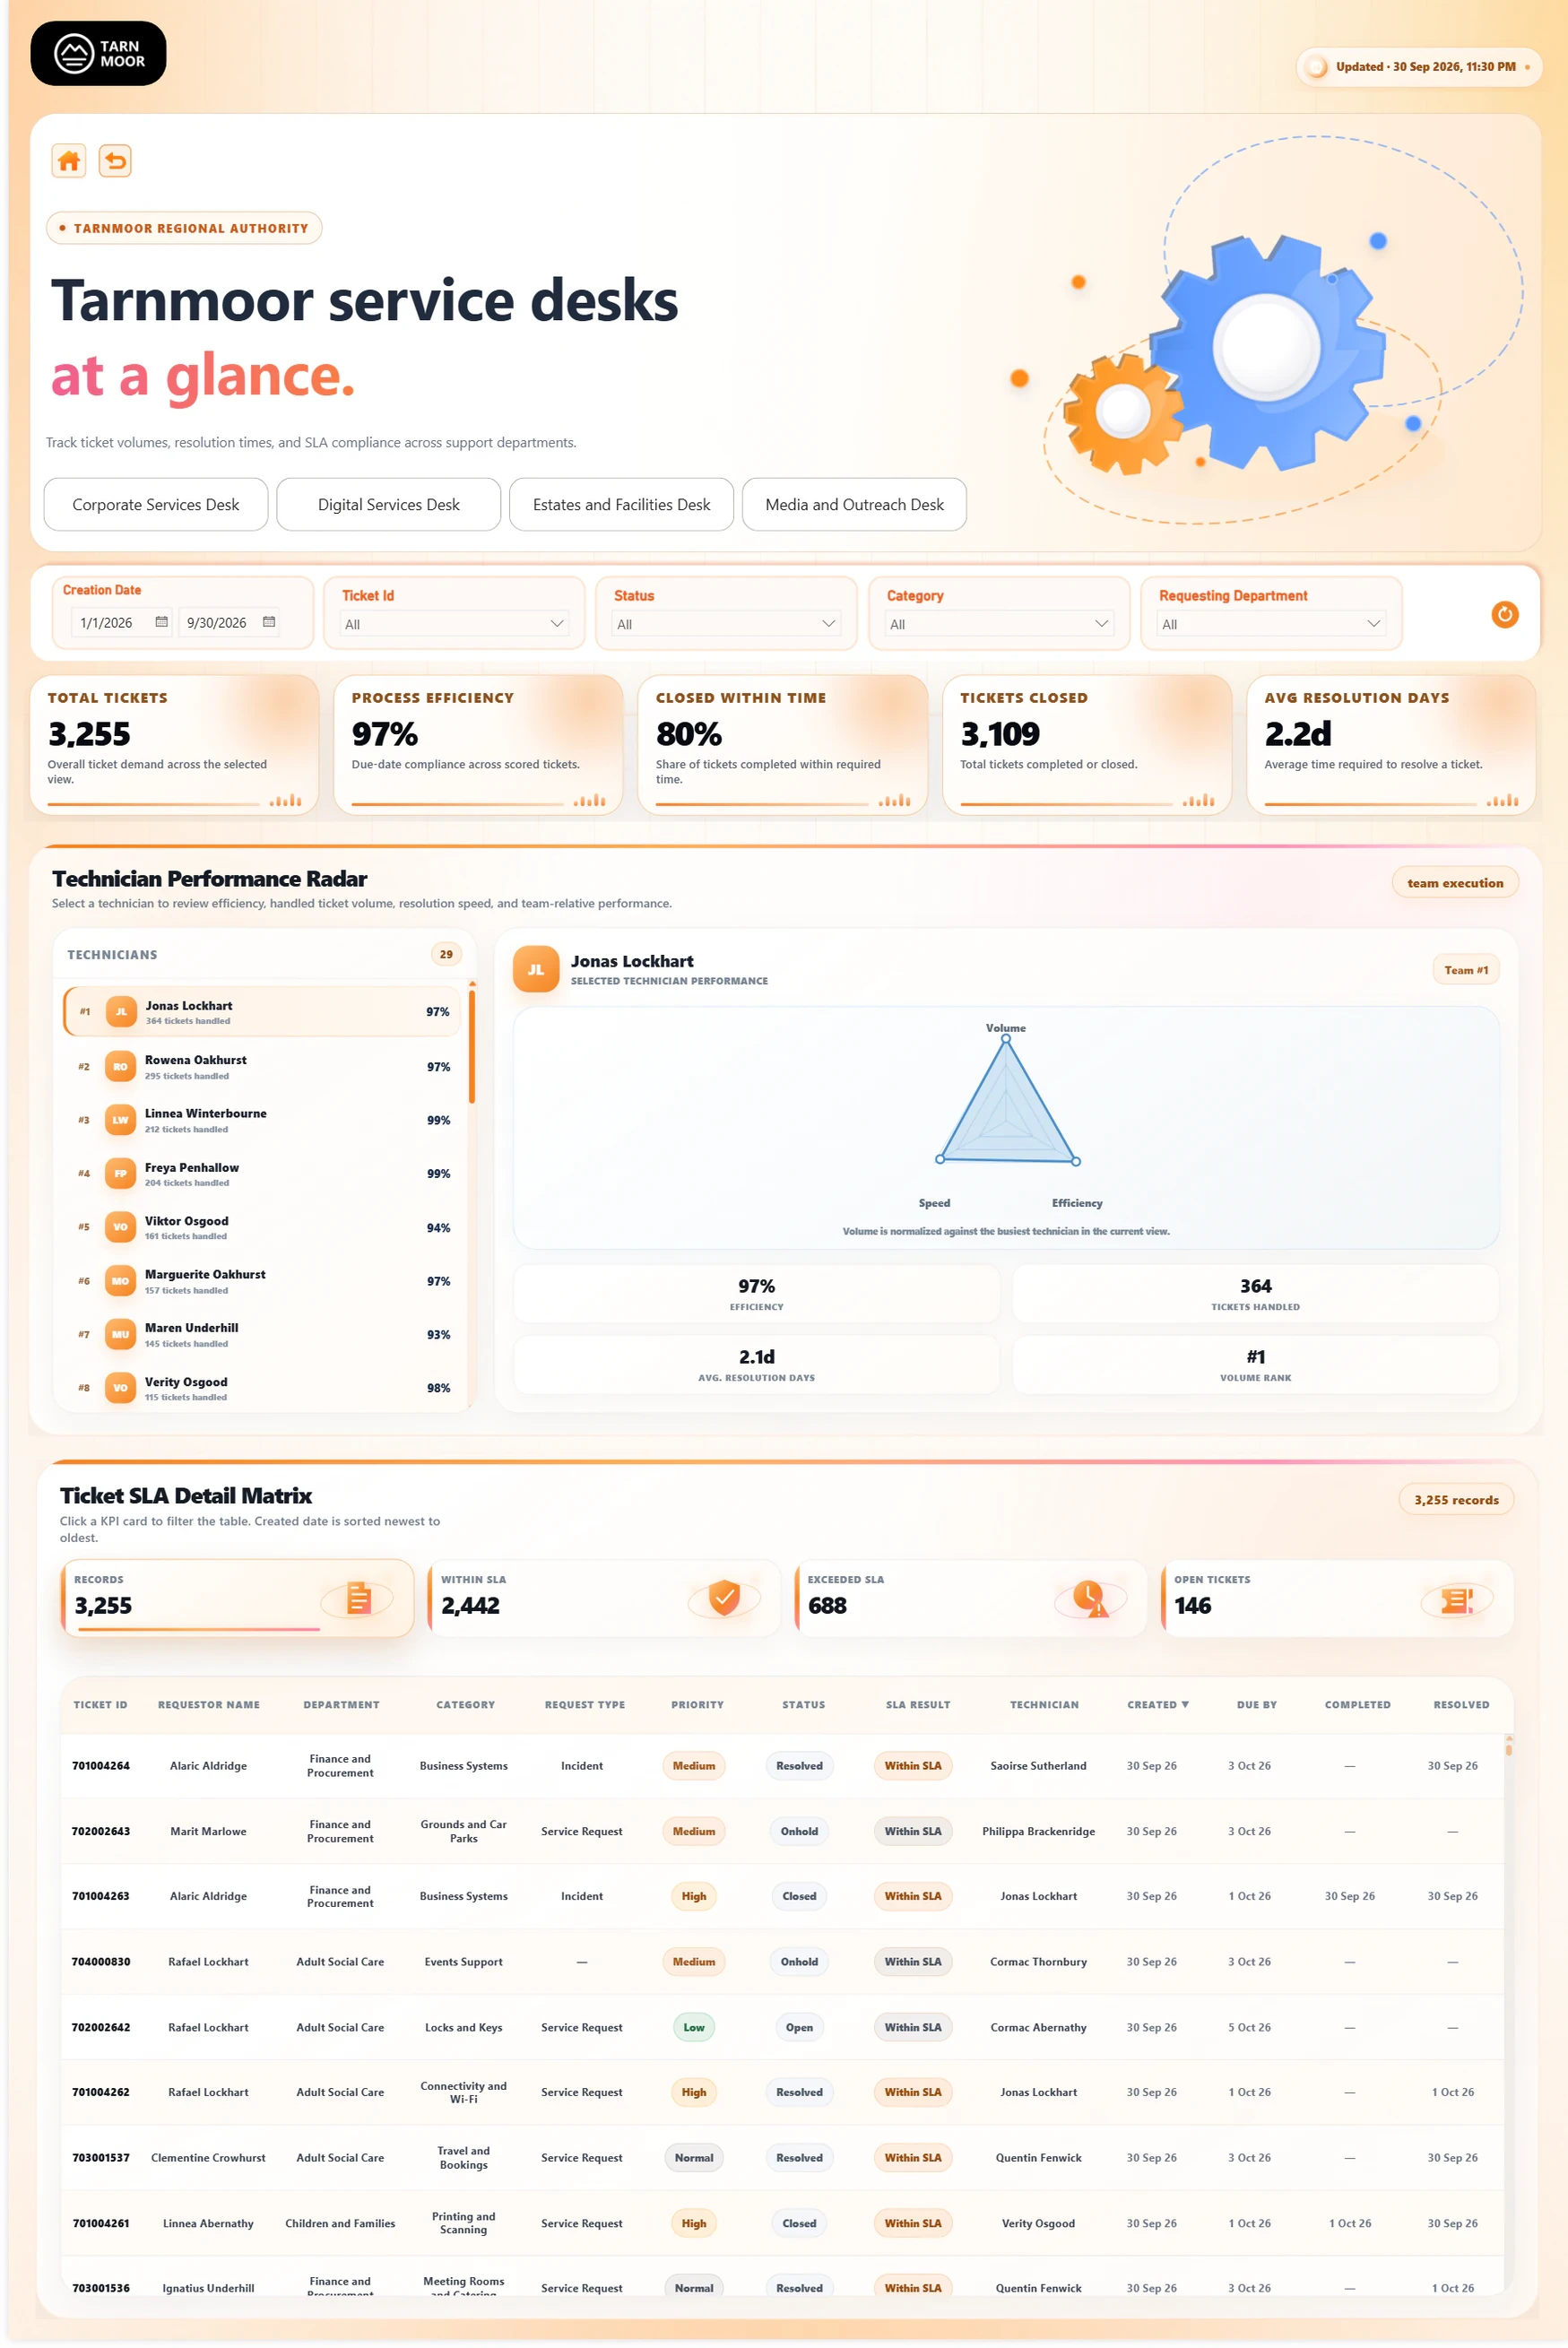
- Internal details. A technician ranking and a ticket SLA table.
How to read the KPIs
A scored ticket has both a due time and an end time. Only scored tickets are judged against an SLA.
- Total tickets. Tickets in the current selection of dates, desks and filters.
- Tickets closed. Tickets whose status is Closed, Resolved or Cancelled.
- Closed within time. The share of scored tickets that ended at or before their due time. One hour late and one month late both count as a miss.
- Process efficiency. The average score of the same tickets. On time scores 100%. Late scores 100% minus 5 points for each day late, never below 0%.
- Average resolution days. Average days from creation to the end time, over tickets that have ended.
- Within SLA, near breach, breached. Ended on time with less than 80% of the allowed time used, on time with 80% or more used, or after the due time.
- Forecast bar. A rule-of-thumb estimate for next month from the months shown, not a statistical model.
Process efficiency versus closed within time
Closed within time asks how many tickets made the deadline. Process efficiency asks how close to the deadline the desk ran overall.
In the demo’s default view, 2,408 of 2,993 scored tickets ended on time, so closed within time is 80%. The other 585 were mostly late by a few days and still score about 84% on average, so process efficiency is 97%.